


Among most companies' organizations, two services have a special impact on software projects: Finance and IT. Historically, they have inherited the responsibility of enforcing internal rules regarding cost and software consistency, hopefully for the better of the whole company. In real life, enforcing finance- and IT-centered rules on other teams results often in conflicts, voiding any potential benefit.
In order to overcome this, more and more companies are adopting a philosophy where finance, IT, and business are actually working together with a value-oriented mindset and a common goal to successfully deliver key projects. This approach coalesced around the term FinOps.
Machine learning (ML) projects are no exception and they should embrace the FinOps approach for several reasons:
- As ML matures, it needs to be cost-accountable. The sooner ML teams work on cost management, the smoother this transition will be.
- A majority of ML projects are using public cloud infrastructure (e.g., AWS, Azure, Google) where cost control is critical.
- ML is inherently resource-intensive, be it to store and process the vast amount of data it requires or to train models, which inevitably translates to high costs.

FinOps is a holistic approach that aims at bridging the cultural gap between teams. From a practical standpoint, you will need accurate cost numbers and allocations to fuel those discussions. This is where the ML solution comes into play: it needs to provide the right data for those teams to make sound strategic decisions. Let’s look at the type of costs the FinOps team may want to look at.
Money Must Be Funny in a Rich Man's World
If you have a financial background or are a hardened budget owner, you will be in familiar territory here. A typical cost analysis is based on CAPEX and OPEX:
- CAPEX is short for capital expenditure and comprises all spending that results in your company gaining a property (e.g., a physical server).
- OPEX is a short for operational expenditure and covers all spending that you need to regularly to operate your business (e.g., a cloud service subscription)
From a financial point of view, OPEX has always been more closely monitored as it impacts key finance indicators such as the EBITDA, and your CFO and shareholders are surely watching those numbers closely.
In the last decade however, cost has actually shifted from CAPEX to OPEX. How can this be? It essentially is based on one trend: the cloud.
With their infrastructure as a service, these providers offer a good compromise between numerous and potential high-value business initiatives and financial control: your cost starts low and increases with business traction, meaning no big spending at a project kickoff when the success or failure is uncertain.
Once live, another key aspect is that this cost evolves in sync with activity: if the project is cancelled or downsized, it will consume fewer or no resources, and its OPEX impact will decrease accordingly. If the project is expanded, it will scale up linearly (no big hardware investment when current infrastructure reaches its limits) and can handle peak activity. This capacity to match cost with activity is one of the main reasons companies are engaging in cloud migration projects.
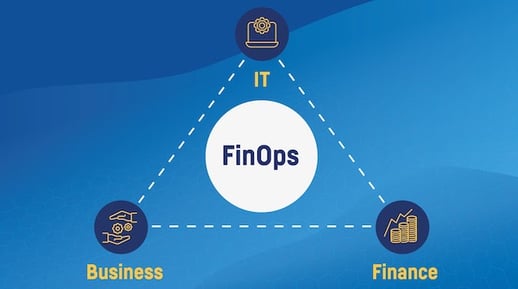
And this is where IT comes into play: they usually are the “owner” of the cloud platform and are tasked with ensuring its consistency, security, and usability. And, most importantly, they own the cost and will need to reallocate it properly. Hence the FinOps triangle:
However, to make this collaboration work, you need reliable data from the field — decisions cannot be taken on uncertain ground, and you can’t let the data platform OPEX constantly rise.
So, a healthy ML solution in a FinOps world must be able to:
- Measure the cost globally across all used services to help build reliable budgets and cost analysis.
- Relate this cost to meaningful and actionable business axes, such as per project, infrastructure, or solution.
This will allow the FinOps team to make decisions based on updated, accurate costs and help highlight where the money is spent as well as where optimization could be conducted (e.g., if two similar projects have widely different costs, maybe one needs to be cost-optimized).
We will see next what numbers actually make sense in a data platform.
Cost Typology of a Data Platform
You obviously need people to drive your ML project, but we will not mention these human costs here. However important that is, we will leave it to a more HROps approach as it is widely different from one company or project to another and also has few ML specificities.
When dealing with the other costs, you have two big buckets: data and compute.
- The cost of data is what you are paying as storage. Most cloud providers are invoicing this per gigabyte (GB), and the resulting total data storage cost (even with huge amounts of data) is usually rather low. For example, on AWS, storing 10 terabytes (TB — or 1,000 GB) of data costs about $250$ on S3 or Redshift. When looking at a global budget, this cost is usually not the issue and can even be recorded approximately without impacting final budget decisions.
- The cost of compute is what CPU you need to transform data, train a model, or make predictions. This cost is more uncertain and potentially much higher, especially in an MLOps approach that encourages frequent retraining of models. Compute costs can also be very diverse — from SQL engines to Kubernetes clusters — making it harder to aggregate.
One other aspect is the cost of integration for your entire solution. This is hard to estimate, and there are unfortunately no standards here. It highly depends on your ML platform architectural decisions. Typically, the more fragmented your platform is between solutions, the more integration costs you will have.
How Does Dataiku Help Manage AI Costs?
As Dataiku is conceptually an end-to-end platform and, as such, integrates with many services, measuring usage and costs is a natural fit.
We will see below how you can leverage Dataiku itself to have a holistic report of your AI project costs with a business perspective. This is not the only option you have — others (like leveraging specific cost-aggregation tools or cloud vendors’ native tools) have their advantages and drawbacks as well.
How to Monitor the Cost of Data with Dataiku
As we saw above, the cost of data is usually small compared to the cost of compute. With Dataiku, you can calculate it using standard data processing. This can be based either on direct connection to the storage system, allowing you to fetch the size of all databases and schema and then calculate the cost with the related pricing you have. Alternatively, you can connect directly to cloud providers’ billing data to fetch the cost and then process it.
Globally speaking, the biggest challenge here will be to decide on how you want to allocate the cost, as data storage is shared among several projects.
How to Monitor the Cost of Compute with Dataiku
As we saw above, measuring and allocating compute is more strategic, but unfortunately, more complex as it needs to aggregate data from several sources. Again, you can retrieve the cost from the cloud provider, but allocating out to meaningful business axes can be challenging and requires advanced data processing.
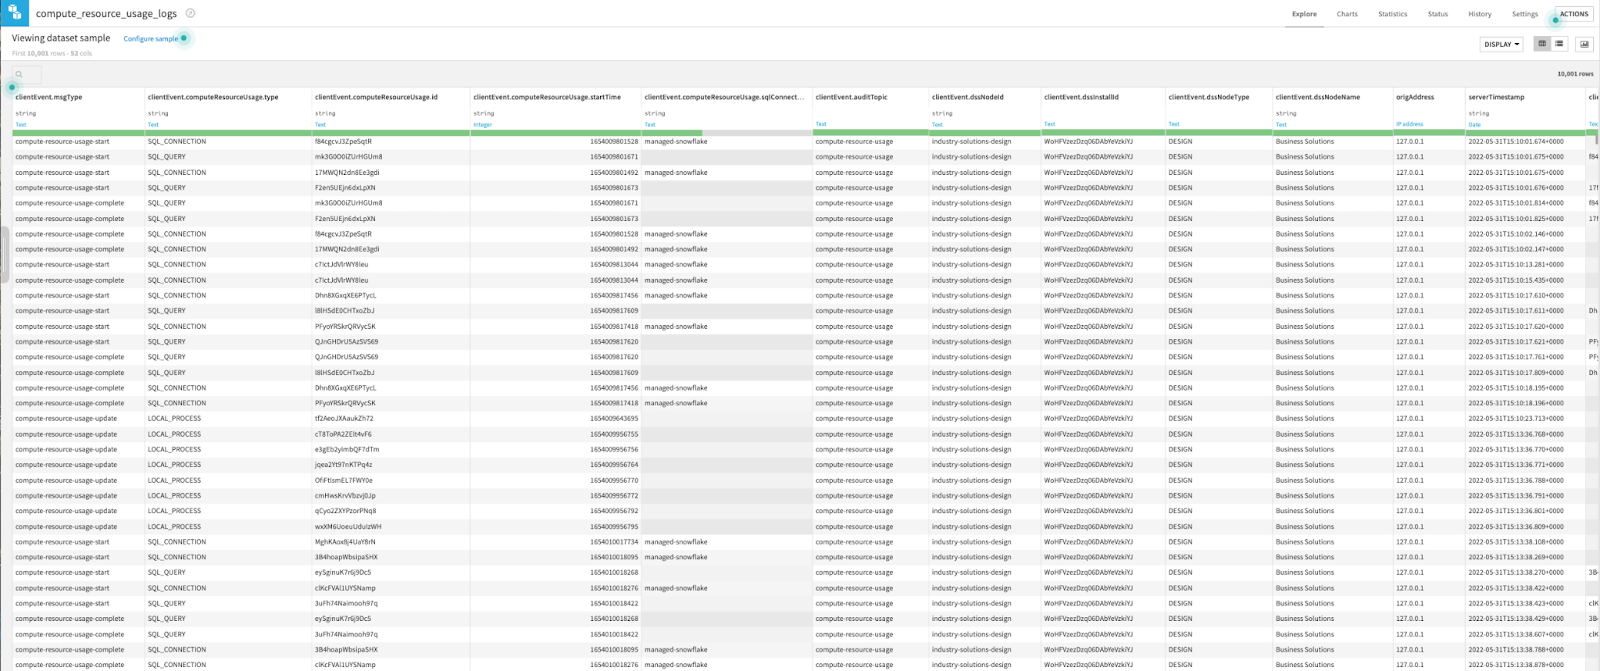
In this spirit, Dataiku has a solution called Dataiku Resource Usage Monitoring specifically conceived for this purpose: it aggregates all possible computing costs and, critically, gives you a very precise lineage on this cost.
Once you start recording this usage, you can actually see the level of detail provided:
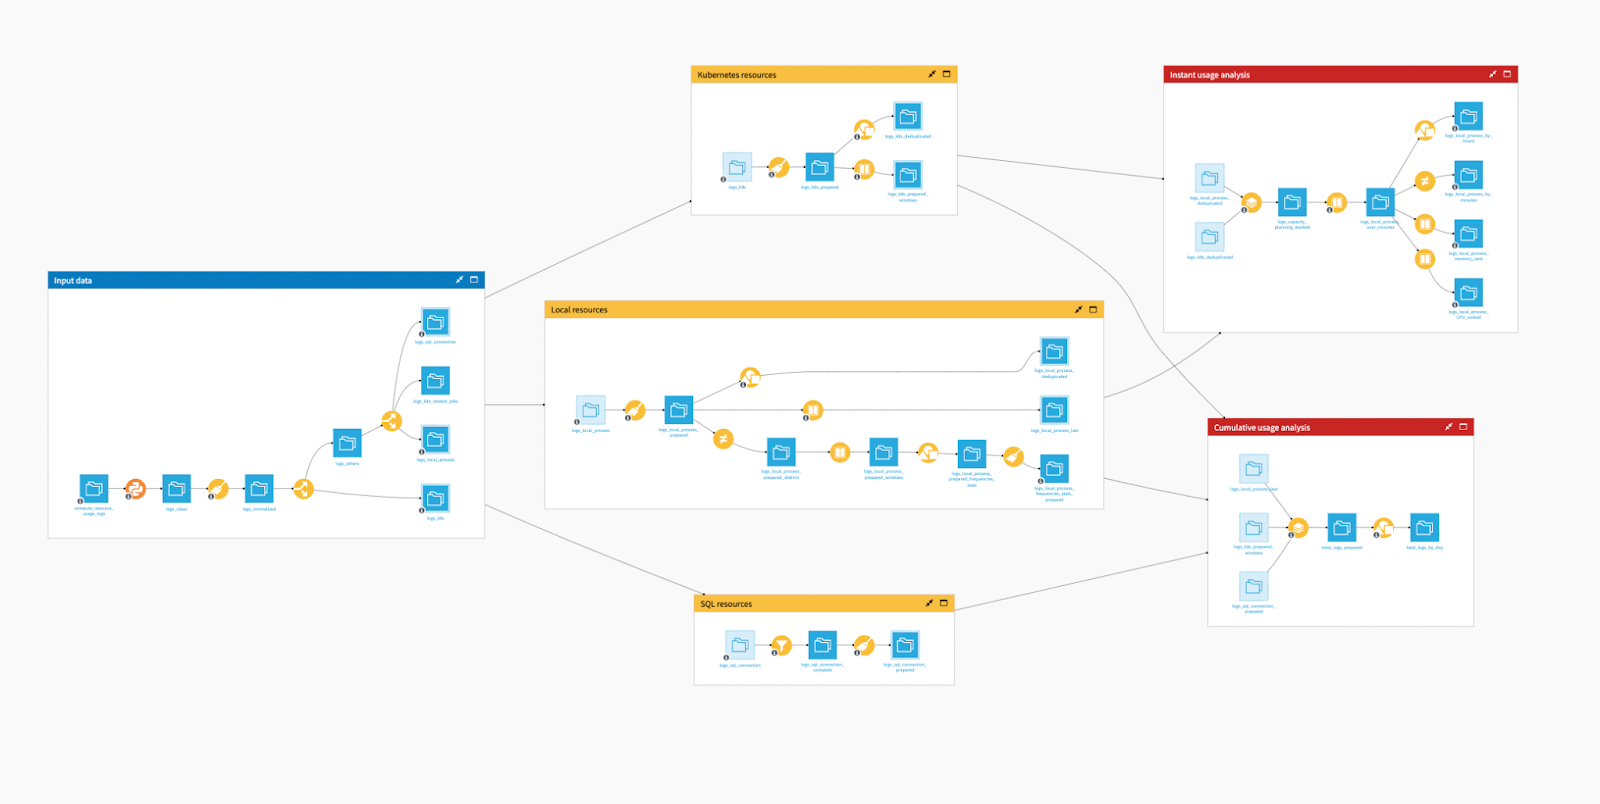
But, even if such data is a gold mine, it needs some work to be actionable. To do this, you need to transform and enrich it, typically with a dedicated project and flow that:
- Filters the compute metrics you are interested in
- Joins with Dataiku structural object lists (projects, recipes, users)
The resulting flow can be simple or complex — it depends on many factors, such as the variety of infrastructure used, or the logic of matching Dataiku projects with business projects. This is the flow of our sample cost analysis project that you can find on our knowledge base:
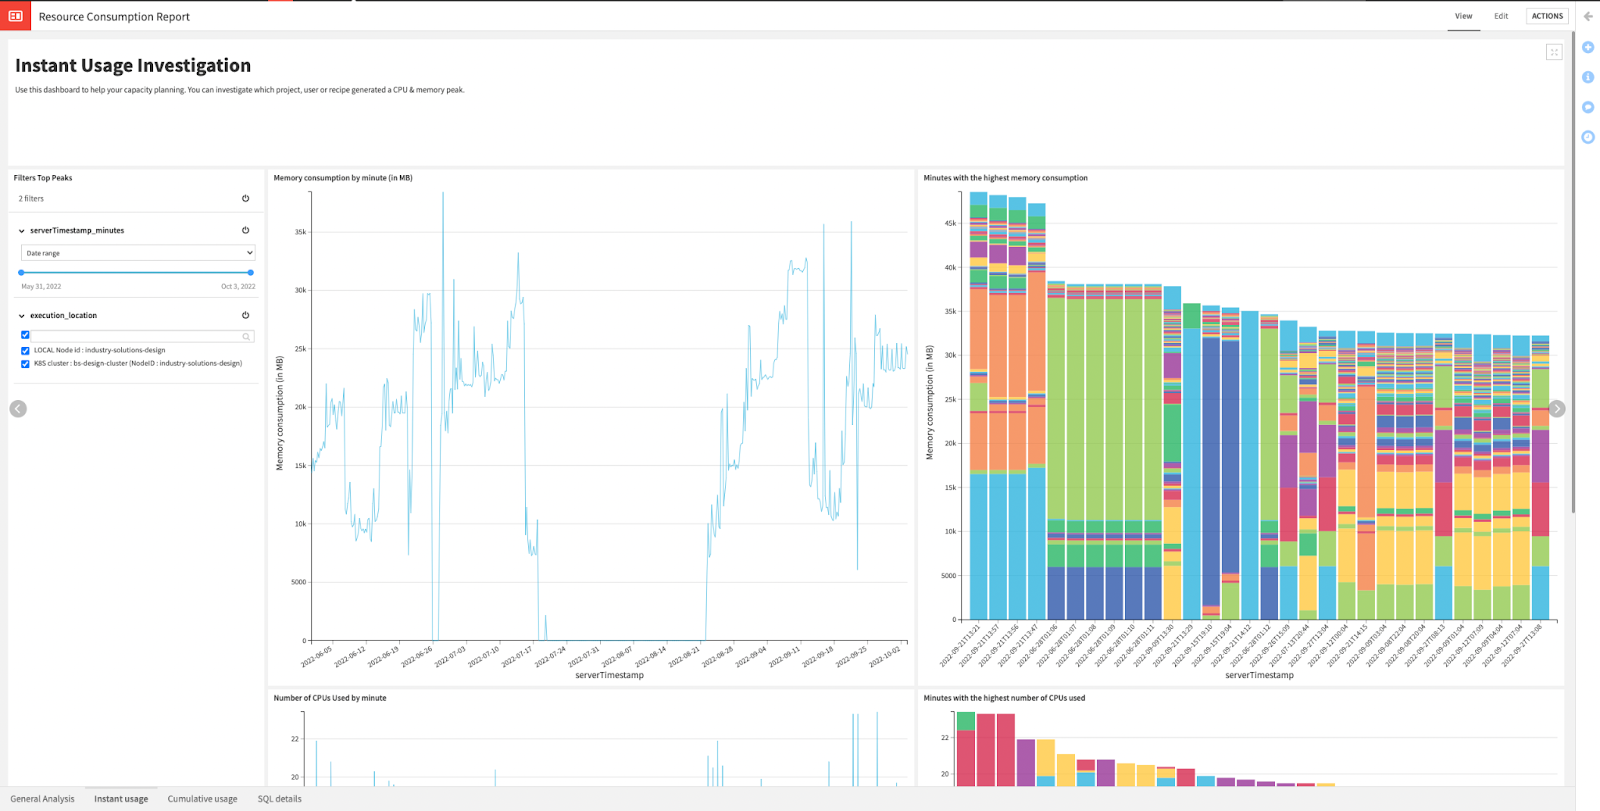
The solution has built-in dashboards that will be updated automatically and can be easily consumed by the project teams, but also by IT, finance, or business sponsors — the infamous FinOps triangle:
How to Make It Count
Now that we have the data, let’s look at how to optimize it. There are of course a lot of specifics here that will depend on how your company is managing cost control, but here are a few hints.
Don’t Wait Too Long to Look at Cost
Building a cost monitoring dashboard is something that should be done globally for all Dataiku projects. There is nothing worse than having to redesign a project to reduce its cost once it is working and ready to go to production (actually, there is worse: doing that once it is in production…).
When a new project is starting, it should automatically be monitored. You can then consider the cost aspect right from the design phase. That is in perfect alignment with the promise of the cloud: start small and match cost with success.
Think Actionability
Once you have a dashboard, think about actions! With the right data, you can identify the proper cost and review projects’ return on investment (ROI) to make decisions.
Should you decide to decrease the cost, the dashboards you have built will allow you to engage in targeted plans, with actions such as removing an entire project, redesigning a project to use less costly resources, decreasing computing jobs’ frequency, engaging with vendors to renegotiate contracts, and probably many more depending on your context.
You may also need more deep-dive analysis, especially with data engineers or architects to help understand the cost breakdown. The capability to split the cost among many different business axes is key in this context to highlight what those people need to focus on.
Use and Reuse
FinOps should not be seen as focusing on optimizing spending only. When you build cross-projects dashboards on costs with detailed breakdown, they should help spot the projects where cost is actually well optimized and see how this can be transcribed to other projects. In other words, FinOps need to be part of the global best practices for your ML projects.

Additionally, reducing cost can also be achieved by factoring operations across your projects. If FinOps can help you identify where factoring can happen, it can be a motivation to trigger such an analysis. Can models be shared among projects (and thus be trained once)? Can portions of your data landscape be pre-processed in a global curated project to be reused (instead of doing this processing in each project)? All those are not direct actions that can be taken by FinOps but are closely related and are great money-savers, on top of their other advantages — a goal that FinOps dashboards are here to quantify.
Next Steps
With all we have seen above, I hope you have more concrete ideas on what you can do around FinOps for ML projects. Should you want to start experimenting with this, here are a few useful links to help you move on