


As organizations become increasingly reliant on machine learning models, it is essential that data scientists maintain model effectiveness and reliability. One aspect that demands attention is data drift. Data drift refers to the phenomenon where the properties of the input data used for training a machine learning model change over time, which can potentially lead to a decline in model performance. Let’s explore what data drift is, detection methods, monitoring strategies, and effective management techniques to ensure your models remain robust and dependable.
Understanding Data Drift
When models are trained on a specific dataset, they learn the underlying patterns, relationships, and characteristics of that data. However, as time goes on, the distribution and meaning of real-world data can change due to various factors such as shifts in user behavior, macro-environmental changes, or data collection methods. This leads to a misalignment between the training data and the operational data, potentially causing the model's performance to degrade. When our machine learning model drifts away from representing reality and, as a result, makes poor predictions, that is data drift.
Types of Data Drift
Imagine we have a model that predicts sales of workout clothing. This model may use various features of each piece of clothing (such as color, size, length, material, and more) to determine trends and make predictions. Let’s use this example to consider the types of drift:
- Covariate/feature drift – This is the input data drift that occurs when the marginal distribution p(x) of a feature changes, but the conditional distribution p(y|x) of those features stays the same. To understand feature drift, we can look at one feature, “Tank top length.” The training set identifies a buyer preference for longer tank tops, and over time the preference drifts towards shorter ones, but the total demand for tank tops has stayed the same. The p(y|x) has not changed, but the distribution of p(x) has.
- Label drift – This input data drift occurs when the actual distribution p(y) changes after the model was trained. For example, the total demand/sales for tank tops have increased across all feature categories, which results in conditional distribution p(x|y) shifting towards a higher value. The model distribution is still good, but the predicted sum will be lower than reality. Therefore we should retrain the model.
- Concept drift - The conditional probability of demand given specific features p(y|X) could change. Let’s rework the previous e-commerce example to understand Concept Drift. Imagine that the marginal distribution p(x) of the tank top sales does not change. Buyers in general prefer higher quality materials, which allows tank tops made with certain materials to become more expensive. The conditional probability of tank top price given the material type could change, especially for the highest quality material tank tops. The price would reflect not only the cost of the materials but also a higher price tolerance by the consumer for a perceived benefit allowing for more profit. Essentially, the trend line across the distribution has changed slope. Concept Drift can also occur when the underlying concept or relationship the model was trained to identify has changed. This could occur for various reasons, like a significant shift in customer behavior.
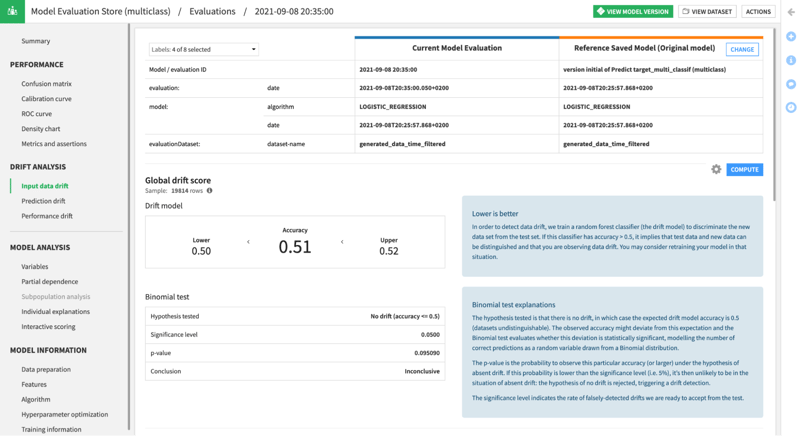
Fig. 1 - Dataiku helps users detect and monitor both input data drift and concept drift.
Detecting Data Drift
Detecting data drift is a crucial step in maintaining model reliability. Fortunately, there are various methods and techniques that can help identify signs of data drift:
1. Statistical Tests: These involve comparing statistical properties of the training and operational datasets. Common statistical tests include the Kullback-Leibler (KL) divergence, Jensen-Shannon, Kolmogorov-Smirnov test, the Anderson-Darling test, Chi-Square test, and others. These tests primarily assess whether the distributions of the two datasets differ significantly.
2. Drift Detection Algorithms: Several drift detection algorithms, such as the Drift Detection Method (DDM) and the Page-Hinkley Test, monitor the model and raise an alert when significant deviations are detected. These algorithms may focus on the input drift of specific features over time or look at the output error rate, for example. Univariate analysis can be useful in identifying important feature drift.
3. Feature Drift Monitoring: By tracking changes in feature distributions, you can gain insights into specific aspects of the data that might be drifting. Visualizations like histograms, density plots, scatter plots, feature importance diagrams, and others can help illustrate drift.
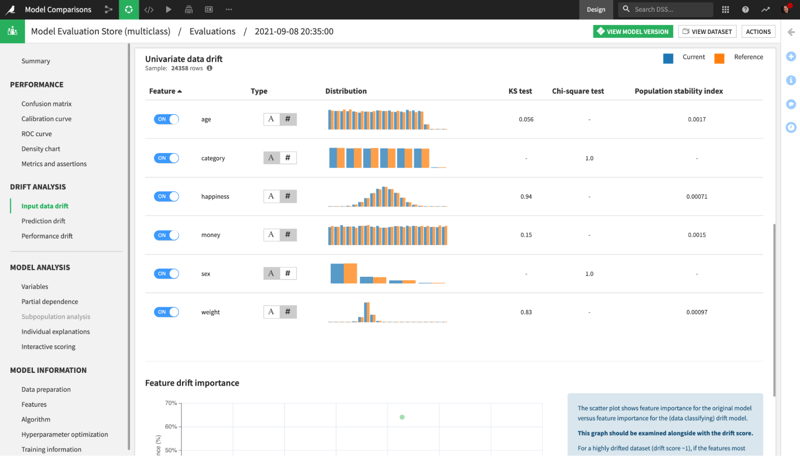 Fig. 2 - Dataiku makes detecting data drift easy with the Evaluate recipe. Use this recipe to generate a Model Evaluation Store to detect, monitor, and visualize data drift.
Monitoring Data Drift
Proactively monitoring data drift is essential to catch issues early and prevent significant degradation in model performance. Here are some methods for monitoring data drift:
1. Automated Pipelines: Implement automated data pipelines that regularly collect and preprocess data. By continuously comparing new data against the training data, you can identify and react to potential drifts in a timely manner. Model prediction drift can be very useful for identifying concept drift, for example.
2. Dashboard Visualizations: Create intuitive dashboards that display key metrics and visualizations of data distribution changes over time. These dashboards provide a quick overview of potential drift and allow stakeholders to make informed decisions.
3. Alerting Mechanisms: Set up alerting mechanisms to notify relevant teams when significant data drift is detected. These alerts can prompt immediate action to investigate and rectify any issues.
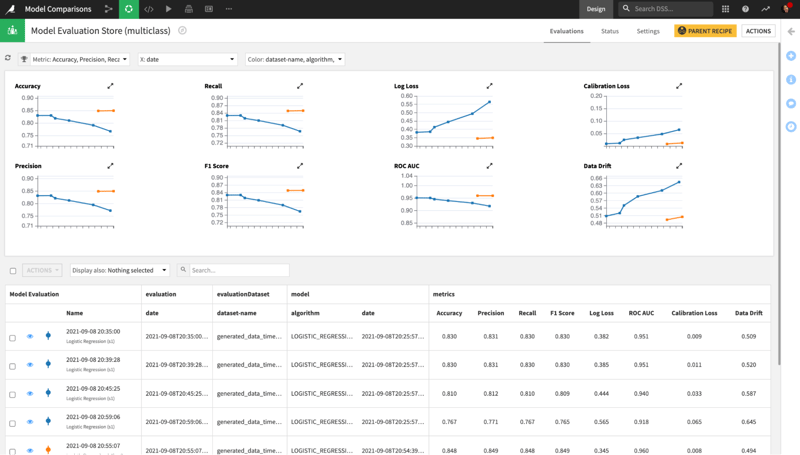
Fig. 3 - The Model Evaluation Store in Dataiku will capture and analyze historical performance metrics for machine learning models in production. Automated drift monitoring and built-in Model Comparisons make it easier than ever to monitor live models to ensure they are performing well and continuing to deliver relevant predictions.
Managing Data Drift
Mitigating the impact of data drift requires a proactive approach and careful consideration of the following strategies:
- Regular Model Retraining: Periodically retrain your machine learning models using up-to-date data. By incorporating recent data, you can ensure that your models adapt to evolving trends and user behavior.
- Adaptive Learning: Implement techniques such as transfer learning or fine-tuning to make your models more adaptable to changing data distributions. These approaches leverage knowledge from the original model while allowing it to learn from new data.
- Ensemble Methods: Combine predictions from multiple models trained on different slices of data to create an ensemble. This can enhance the model's robustness and reduce the impact of data drift.
- Feedback Loop: Establish a feedback loop between your deployed model and the data it encounters in the real world. Collect user feedback and use it to improve your model's performance over time.
Data drift is a natural challenge in the realm of MLOps. However, by detecting it early, monitoring it diligently, and implementing effective management strategies, you can ensure that your machine learning models remain accurate.
Learn more about the Model Evaluation Store and how this feature helps you manage data drift.