


We already studied Medicare data using Dataiku in this video. This time, instead of looking at the impact of payments on the physician prescriptions, we will have a look at the possibility of detecting Medicare fraud.

NOTE: This blog post was updated in 2020, but the video has not been updated and shows the project in Dataiku in 2015. You can check out a much more up-to-date version of Dataiku in action here.
-
The corresponding notebook is available in HTML version or iPynb version.
-
The corresponding PostgreSQL dump is available here and here are the SQL scripts.
I chose to work with HP Vertica, mainly because it processes aggregations of big datasets very quickly. The simplified project was done on PostgreSQL so that most people can set up it quickly.
To analyze Medicare fraud, we will need the following datasets:
-
The PartD 2013 Medicare data set available here. It contains all 2013 prescriptions aggregated at the physician and drug level, as well as information on the physician (National Physician ID (NPI), name, city, postal code, etc.).
-
PartD for years 2011 and 2012 data sets are available on the Propublica website. Do not hesitate to have a look at their publications, they were a great source of inspiration for me.
-
Labeled data. There is a nice data set on NPI exclusions. However, beware that being in the exclusion list is just a proxy we will use for this blog post. We won't extrapolate on our prediction results because this is a fraudster-based target and not a fraud one, so we will be unable to detect cases like the one of Ortiz-Butcher, a physician victim of a fraud web. As a result, this will probably limit our performance.
-
Payments: In the U.S., physicians now have to declare any payment they receive from pharmaceutical companies.
-
FDA datasets (optional) that will help us join drugs and active ingredients.
A First Model
The most interesting dataset is PartD, in which we have for each physician (identified by its NPI) and drug, the total amount of prescriptions, total cost and total number of days prescribed. From this, we should be able to create a few features to qualify the chance of each physician to be a fraudster. I chose to concatenate the three PartD datasets and create feature out of this.
Deriving basic features is straightforward. I summed all years to get a simpler dataset and calculated the following features:
-
The number of different drugs prescribed
-
The sum of the number of prescriptions, the sum of the number of days prescribed, and the sum of the total cost
-
The variance of these three quantities
-
The maximum of these three quantities
This can easily be written in SQL with:
-- take mean, max and variance of
-- nb of prescriptions, nb of days and total cost
SELECT npi
    , min(speciality) as speciality
    , count(*) as nb_diff_prescriptions
    , sum(nb_prescriptions) as sum_prescr
    , sum(nb_days) as sum_days
    , sum(cost) as sum_cost
    , max(nb_prescriptions) as max_prescr
    , max(nb_days) as max_days
    , max(cost) as max_cost
    , variance(nb_prescriptions) as var_prescr
    , variance(nb_days) as var_days
    , variance(cost) as var_cost
FROM PartD_no_year
GROUP BY npi
;
The idea behind these features is simple: we expect fraudsters to have a higher total cost in general, because what would be the point of committing fraud for smaller amounts of money? We can validate this hypothesis by looking at the mean cost, days, and number of prescriptions of non-fraudsters versus fraudsters.
But things are often not that simple: some physicians prescribe a lot of drugs (general practitioners or example) or highly expensive drugs (oncologists, cardiologists, etc.). So a high total cost could be explained by other factors. On the other hand, some fraudsters will particularly use one drug to commit fraud. We can attempt to catch this by measuring the maximum and the variance of the cost.
Since we are using data from PartD between 2011 and 2013, I choose to only look at NPI excluded since 2014. Indeed, we need to have data on the fraudster, so we can exclude any date before 2011. We will also have a problem if the exclusion happened during a year we have in PartD because this could lead to biased values of PartD due to exclusion. As a result, our target is not perfect since some fraud NPIs are still in the dataset with a target value of "not fraudster". We also face the problem of having an extremely unbalanced dataset: there are only 298 fraudsters for 808022 NPIs (ie. 0.037 % of fraudsters).
We can still use our features to create simple fraud models, but using Dataiku, our model does not perform very well:
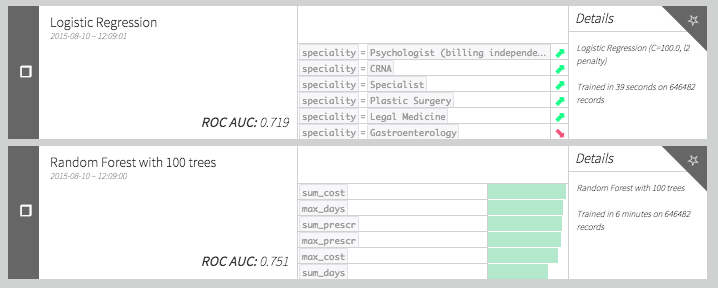
This is because we have very few actual examples of fraud in the dataset. This can also be observed on the ROC curve. Because we have only approximately 50 positive points for evaluation, the curve is not smooth at all. The problem does not seem to be an easy one!
Can we do better? Let's try to get some better features. Why would a physician defraud Medicare? Perhaps to make more money either by selling the drugs (by making fake prescriptions) or by charging Medicare too much for some drugs. The first reason raises the question of which drugs could be the fraudsters favor: probably the very expensive ones or the drugs that could be use in a "recreational way." The second one boils down to looking at outliers in the unit price of drug distribution.
Adding Some "Outlier Detection" Features
Let's add some features to our model. As we said before we could have some physicians behaving normally except for certain drugs. We could catch that by checking for the outliers in cost distribution or more simply at the 99 percentile of the distribution. But since some drugs are mostly prescribed by certain specialities, we have to check percentiles by drug and speciality. Now if we add +1 to a NPI score every time the corresponding physician is in the 99 percentiles for a drug and a speciality we get a new set of interesting features.
We can do the same for the unitary price distribution for each drug. Does a physician tend to charge Medicare too much for a particular drug? We can easily translate that using a few window functions in SQL:
SELECT npi
    -- count number of times being an outlier happens
    , sum(perc_pres) as nb_perc_presc
    , sum(perc_days) as nb_perc_days
    , sum(perc_cost) as nb_perc_cost
    , sum(perc_unicost) as perc_unicost
FROM (

    SELECT *
        -- set 1 if npi is in the 1 %
        -- of best prescriber of a drug in its speciality
        , (ntile(100)
              over (PARTITION BY speciality, drug
              order by nb_prescriptions asc)=1)::int as perc_pres
        , (ntile(100)
              over (PARTITION BY speciality, drug
              order by nb_days asc)=1)::int as perc_days
        , (ntile(100)
              over (PARTITION BY speciality, drug
              order by cost asc)=1)::int as perc_cost
        -- set 1 if npi is in the 1 %
        -- of best prescriber of a drug in its speciality
        , (ntile(100)
              over (PARTITION BY drug
              order by unitary_cost asc)=1)::int as perc_unicost
    FROM (
        SELECT *
            , "nb_days" / "cost" as unitary_cost
        FROM PartD_no_year
        ) partd
    ) ntiles
GROUP BY npi
;
Using these new features we get a result that is not really better than what we had previously. Maybe our features are not that well designed and we need to review our outlier definition. Let's try to replace these features with something "classical" and define an outlier as a point that has a greater value than the mean plus four standard deviations. It is easily done via SQL using the following query :
-- count number of times being an outlier happens
SELECT npi
    , sum(perc_pres) as nb_perc_presc
    , sum(perc_days) as nb_perc_days
    , sum(perc_cost) as nb_perc_cost
    , sum(perc_unicost) as perc_unicost
FROM (
    SELECT *
        , (nb_prescriptions > mean_nb_prescriptions
          + 4 * sqrt (var_nb_prescriptions))::int as perc_pres
        , (nb_days > mean_nb_days
          + 4 * sqrt (var_nb_days))::int as perc_days
        , (cost > mean_cost
          + 4 * sqrt (var_cost))::int as perc_cost
        , (unitary_cost > mean_unitary_cost
           + 4 * sqrt (var_unitary_cost))::int as perc_unicost
    FROM (
        SELECT *
            -- calculate avgs
            , AVG(nb_prescriptions)
            over (PARTITION BY speciality, drug )
            as mean_nb_prescriptions
            , AVG(nb_days)
            over (PARTITION BY speciality, drug )
            as mean_nb_days
            , AVG(cost)
            over (PARTITION BY speciality, drug )
            as mean_cost
            , AVG(unitary_cost)
            over (PARTITION BY speciality, drug )
            as mean_unitary_cost
            -- calculate vars
            , variance(nb_prescriptions)
            over (PARTITION BY speciality, drug )
            as var_nb_prescriptions
            , variance(nb_days)
            over (PARTITION BY speciality, drug )
            as var_nb_days
            , variance(cost)
            over (PARTITION BY speciality, drug )
            as var_cost
            , variance(unitary_cost)
            over (PARTITION BY speciality, drug )
            as var_unitary_cost
        FROM (
            SELECT *
                , "nb_days" / "cost" as unitary_cost
            FROM PartD_no_year
            ) partd
        ) avgvar
    ) final
GROUP BY npi
;
Now our models give:
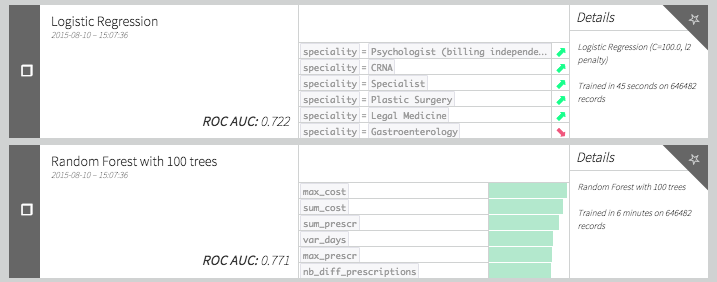
Which seems better that the models without these outliers variables.
Impact Coding Drugs
As we said previously, some drugs may be expensive to get or have "recreational drug use". As a result we could assume that actually prescribing some drugs can be a feature of importance for fraud detection. To check if this can be the case, let's have a look at the list of best "impact coded" drugs.
The idea is to check the percentage of time a drug was used in a fraud. In the following table we have calculated for each drug the number of times we see it in the dataset, the number of times it is prescribed by a fraudster, the corresponding percentage and the percentage of time weighted by the total cost. The weighted percentage seems a better heuristic since it also incorporates the fact that a fraudster wants to make money out of it. If we sort by descending "cost_weighted_percent_fraud" and keep only the drugs which were prescribed by at least five fraudsters, we get a list.
So what do we have ? Well the first one is Lidocaine. According to Wikipedia : "Lidocaine is often added to cocaine as a diluent. Cocaine numbs the gums when applied, and since lidocaine causes stronger numbness, a user gets the impression of high-quality cocaine when in actuality, the user is receiving a diluted product." I've seen enough Breaking Bad to know where this is going.
What else? Opana, Suboxone, Oxycodone, Oxymorphone and Methadone are addictive opioids. The last one on the list is Amphetamine which is known to be used for recreational purposes. The rest are mostly skin irritation creams and heart disease medications. I have no explanation for these other drugs but I believe there is a general pattern here.
How can we use this information for our model? Adding the amount of lidocaine or any other drug in our top would be data leakage since we have already used the information of fraud itself to create the list. The solution I propose is to do a modification of impact coding rather similar to what I did for the Human Robot Kaggle competition.
The idea is the following:
-
If I had a score for each drug, I could compute a score for each physician: the weighted score of each drug (weighted by 1 for average, weighted by cost ... etc. )
-
I could have a score for each drug by calculating a weighted (or not) percentage of physician who are fraudsters and prescribe the drug.
-
If for each physician I can calculate the drug score with all physician contributions except the one of interest, I avoid data leaks. You can do all of this in SQL because the contributions are linear so the contribution of all but one physician is actually the total minus their own contribution.
As a result we can create two new variables, score and cost_weighted score with the following SQL query (this is the kind of query that makes you love SQL) :
SELECT npi, sum(percent_drug * weighted_drug_score) as weighted_score, avg(drug_score) as score, min(is_fraud) as is_fraudFROM (SELECT base.* , cost / sum(cost) over (partition by npi) as percent_drug, sum(cost) over (partition by drug) - cost as total_drug, (sum(cost * is_fraud) over (partition by drug) - cost*is_fraud)/GREATEST((sum(cost) over (partition by drug) - cost),0.00000000001) as weighted_drug_score, (sum(is_fraud) over (partition by drug) - is_fraud)/GREATEST((count(*) over (partition by drug) - 1),0.00000000001) as drug_scoreFROM(select partd.* , CASE WHEN EXCLDATE IS NULL THEN 0 ELSE 1 END as is_fraudfrom partd_no_year partdLEFT JOIN exclusions_after_2014 ex ON partd.npi = ex.npi) base) s1GROUP BY npi
Note that for each line we only add information from other NPIs. As a result, we do not leak anything here. Also notice that this could be seen as a propagation of the fraud information in a bipartite graph: with physician and drug nodes. If we simplify this bipartite graph into a graph with all node being physicians, our score is juste a weighted percentage of fraudster neighbors in the graph! Some other graph features could probably be derived (see these slides for example).
What do these new features do?
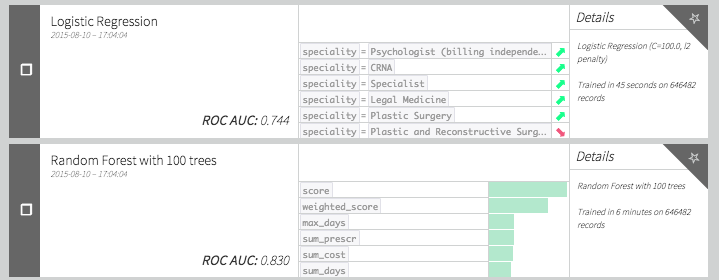
A very good improvement! Can we do even better?
Adding Other Datasets Information
We can ask ourselves if there is a link between committing a fraud and receiving large payments from pharmaceutical companies. In this post, we will simply create a feature being the total sum of payments received in 2013 without distinction of payment type or company. Since the referential is not the same we have to join by physician first name, last name, city and state. Using this new feature we get the following scores:
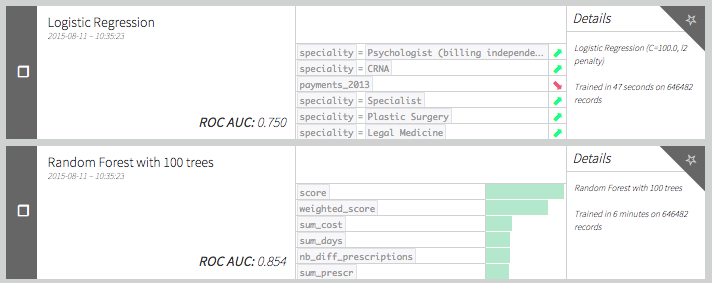
Turns out it actually increases the model performance! Funny thing: payments seem to be negatively correlated with fraud (according to our logistic regression coefficient). Is it because fraudsters try to stay discrete or because companies avoid physicians they know to be fraudulent?
I tried some other feature engineering I won't explain in details in this post. Because the drug field could be a brand name as well as a generic drug, we can think of working with the active ingredient instead of the drug. To do so, we can use this FDA data and fuzzy join on the drug name. We can then recreate analog features (sum, maximum and variance of cost, physician impacted score, etc.) using active ingredient instead of drug. It seems to improve a bit the performance when using k-fold cross-validation and a random forest, probably because it makes each tree a bit more diverse.
Conclusion
It seems possible to construct basic fraud models using the Medicare data. Of course, the performance is not very good due to the lack of labelled data.
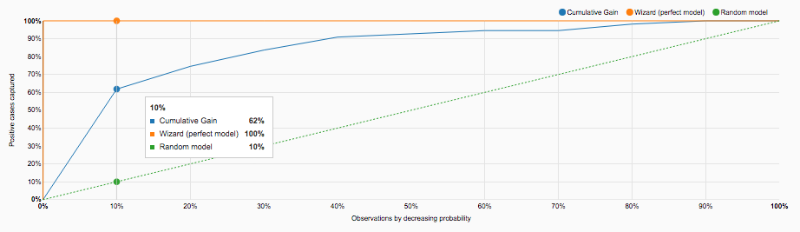
However, we still get nice insights on the most used drug for medicare fraud. The model could also be used as help for Medicare fraud detection. Since we still need people to actually look closely to detect fraud pattern, checking first NPIs with high score makes sense. Indeed, if we analyze the Lift curve below, we realize that by looking at the top 10% highly scored physicians, we retrieve 60% of fraudsters.
We focused on supervised machine learning but unsupervised methods could be of interest. Because we have very few labels, it could be worth testing more advanced outliers detection technics.
For example, in this very nice analysis, Ofer Mendelevitch (Director Data Science at Hortonworks) ran a modified version of PageRank algorithm on the physician graph, and is able to detect doctors whose prescriptions pattern seem odd. This report also gives other ideas to go deeper into the fraud analysis.