


AI is increasingly at the center of our most critical customer interactions — it drives decisions about how we treat customers, how we respond, how we service, and what we recommend to customers.
As we scale AI to more human interactions, inevitably citizens and consumers are concerned about what they sometimes perceive as biased, unfair, or unexplainable decisions made by faceless machines. They (and their governments) demand data scientists, data engineers, and AI developers answer one deceptively simple question: How can we help non-technical people make sense of the AI-based decisions that impact their daily lives? In other words, how do we explain AI to people impacted by it? In this blog, we’ll take a look at some of the ways we can approach model interpretability within Dataiku.
Why Me? Explaining Cause and Effect
Humans have an innate need to be able to interpret or understand “the cause” of decisions, from the very consequential (medical decisions) to the seemingly trivial (song recommendations). Our brains are pattern-seeking machines. What customers really want to know is, “Was this outcome, decision, or recommendation accurate and was it fair?” For example:
- Why was I denied credit, when you gave my husband a large line of credit?
- Why did my friend’s doctor treat his similar symptoms aggressively and my doctor took a wait-and-see approach? Was my ethnicity a factor?
- Why did my client get a five-year sentence and his client get parole for almost exactly the same crime? Was it my client’s race?
- Why was my application ignored when my male friend got an interview, even though we have essentially the same experience? Was it because of my gender?
Being able to offer a satisfactory answer in human terms to these questions may largely depend on the complexity of the model and the tools available to construct an answer. And by the way, no single tool can answer these questions completely, but in Dataiku there are tools to build models with high explainability and interpretability and diagnostic approaches to control for bias and unfairness in models.
Complexity Matters in Model Interpretability
Even for simple classification models, explaining why someone was put into group A versus group B is difficult to put in plain language that would satisfy most customers (let alone regulators). With neural nets and other complex algorithms, explanations are often not even possible and generally referred to as “black box.”
Black-box models have attracted the ire of consumers and regulators, so applying deep learning and other complex models in applications that impact people could be severely curtailed by government regulations, like the recent EU proposed Artificial Intelligence Act, unless we can develop tools that allow us to peer into these models and explain decisions in human terms. While the science of model interpretation progresses, implementing highly interpretable white-box models and using tooling to explain outcomes may be the safest and surest route to business transformation.
Offering Explanations
The answers being sought from model interpretability are deeply causal, which is difficult to derive in machine learning (ML) where we are mostly dealing with correlation. But the analytical tooling to help understand models is getting us closer to true model interpretability.
Below is a quick summary of tools. And a quick caveat here, the hope of Responsible AI is that by using these measures below, models demonstrating bias and unfairness never get deployed into production. But that’s another topic for another blog on Responsible AI and AI Governance.
Fairness, Bias, Parity, and Odds
One of the best ways to observe model behavior is an analysis of fairness metrics, including demographic parity, equalized odds, equality of opportunity, and predictive rate parity.
These measures are computed from three inputs, the sensitive column you want to measure, the sensitive group you want to evaluate, and the advantaged target. Model fairness reports get us close to achieving model interpretability.
Demographic parity measures whether people across different demographic groups have an equal chance of achieving a desired outcome (i.e., will receive the same medical treatment, be hired, or granted credit.) Inversely, it is an indicator of whether the model is biased against a certain demographic. It requires an equal proportion of positive predictions in each group to measure against disparate impacts.
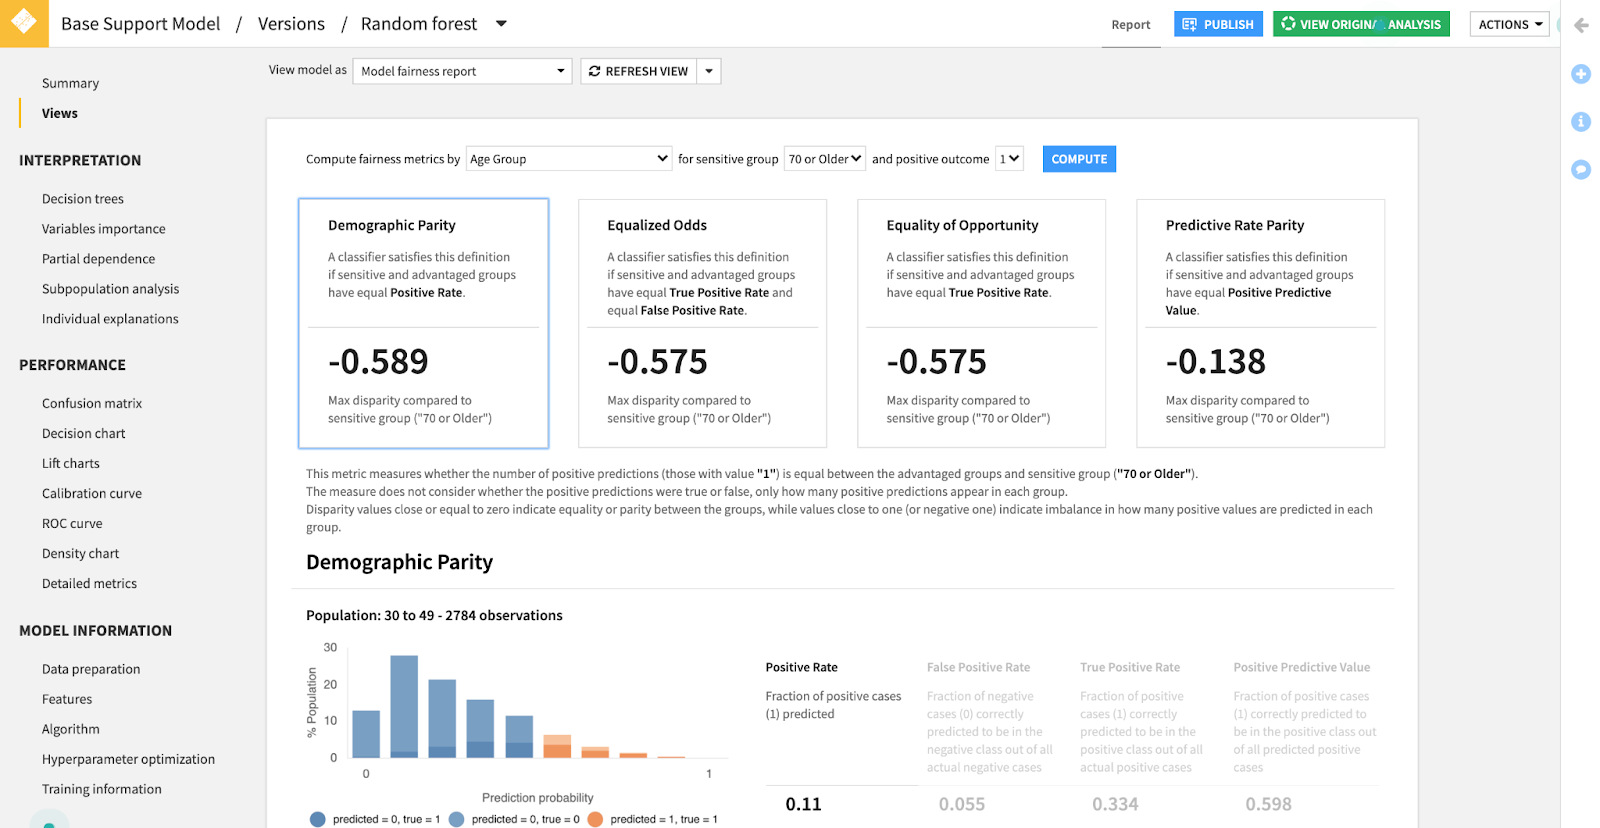
Our sense of fairness is often expressed as having an equal chance at something. What is reduced to in terms of model interpretability is this — was I treated in any way differently than other people like me? In model fairness terms, this is measured as equalized odds, meaning that you had just as likely a chance of your application being rejected as other people who had their application rejected. And conversely, you had just as good a chance of being accepted to university as others who were accepted. In other words, the model showed no favoritism in either direction and treated you exactly as it would have regardless.
Equality of opportunity tests the assumption among the advantaged group whether people were predicted to get what they deserved. In other words, if you had a good credit profile, you are likely to get the loan, if you had great academic achievement, you are likely to be accepted to university, and so forth. To this extent, it only looks at one half of the picture addressed by equalized odds. The interesting thing about equalized odds and equality of opportunity is that you can discover predictors from these metrics and add a remedy on the back-end of the model.
Predictive rate parity, sometimes referred to as sufficiency or outcome test, measures how closely the various groups are likely to have a successful outcome (e.g., have a positive outcome, such as not defaulting on a loan at a different rate than all groups that received loans).
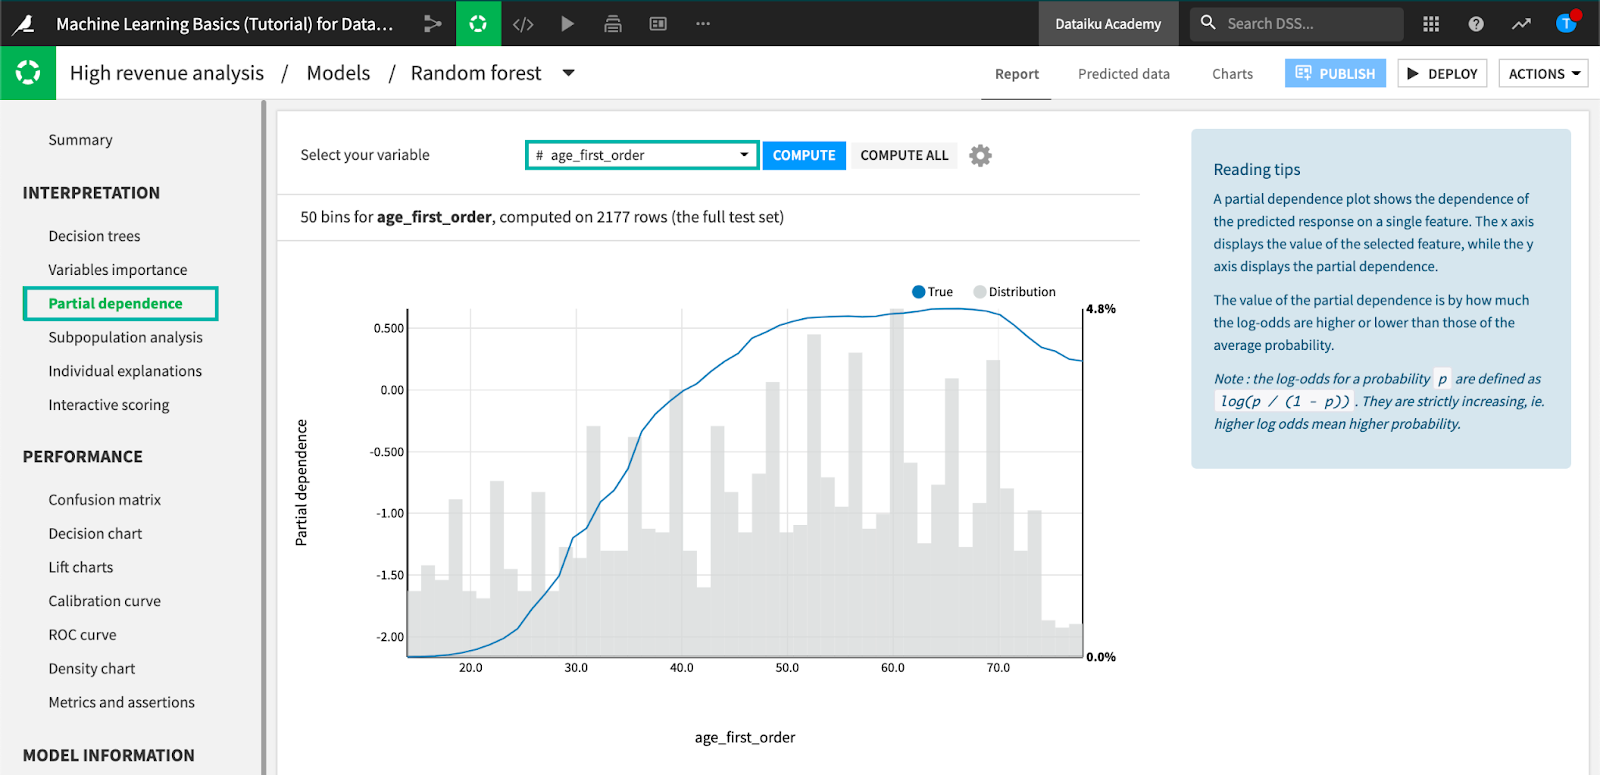
Partial Dependence Plots
Partial dependence shows the negative or positive relationship between variables and is calculated differently for categorical variables versus number values. Once we eliminate the data science jargon around computing partial dependence (“log-odds” and “aggregate modalities”) it boils down to interpreting how dependent the prediction of a single feature is within the model. In plain language, does it matter if you're female or male, Hispanic or non-Hispanic, rich or poor. That’s a little over simplified, but not a bad start toward model interpretability.
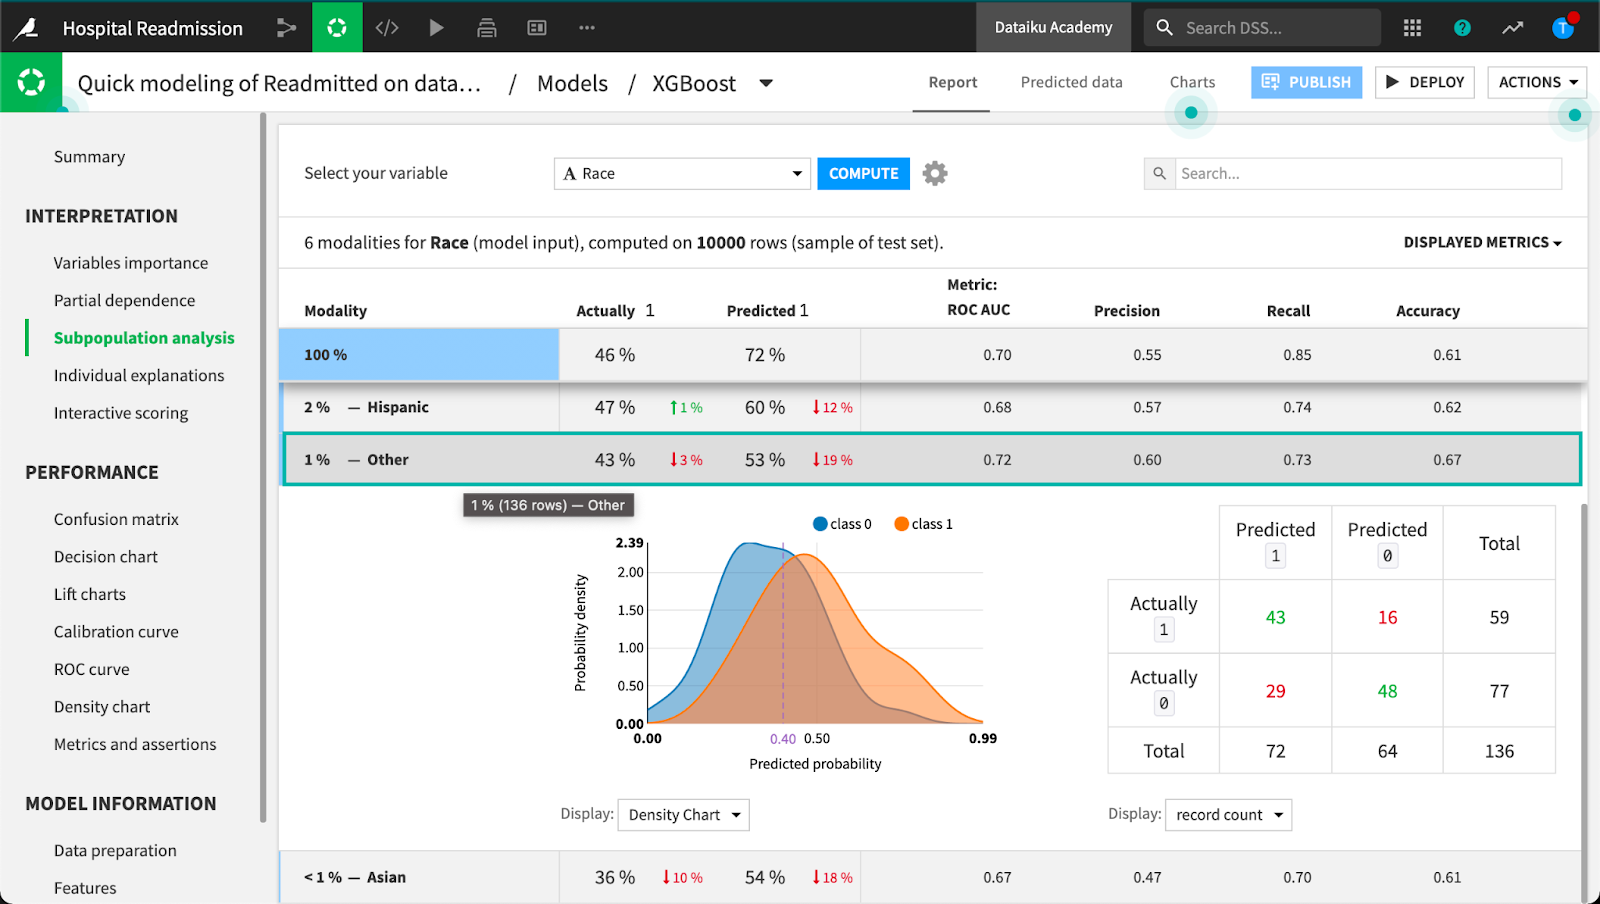
Subpopulation Analysis
We should always be vigilant when examining model interpretability, whether we can clearly see when the model is biased or unfair toward a group of people, defined by any attribute, race, income, age or gender for example. While this is an analytic technique, the ultimate judgement of bias and fairness (i.e., where the inter-group differences are unacceptable) is a human judgement.
Using the subpopulation tool, we can assess if the model behaves identically across different groups of people or if the model shows biases for or against certain groups. We can look at subgroups by both numerical and categorical variables. This is critical when examining lending patterns, criminal sentencing, and patient outcomes. In clinical trials and pharmaceuticals, this analysis is taken to an entirely new level because subpopulation differences transcend bias and unfairness and can be a matter of life or death for some groups.
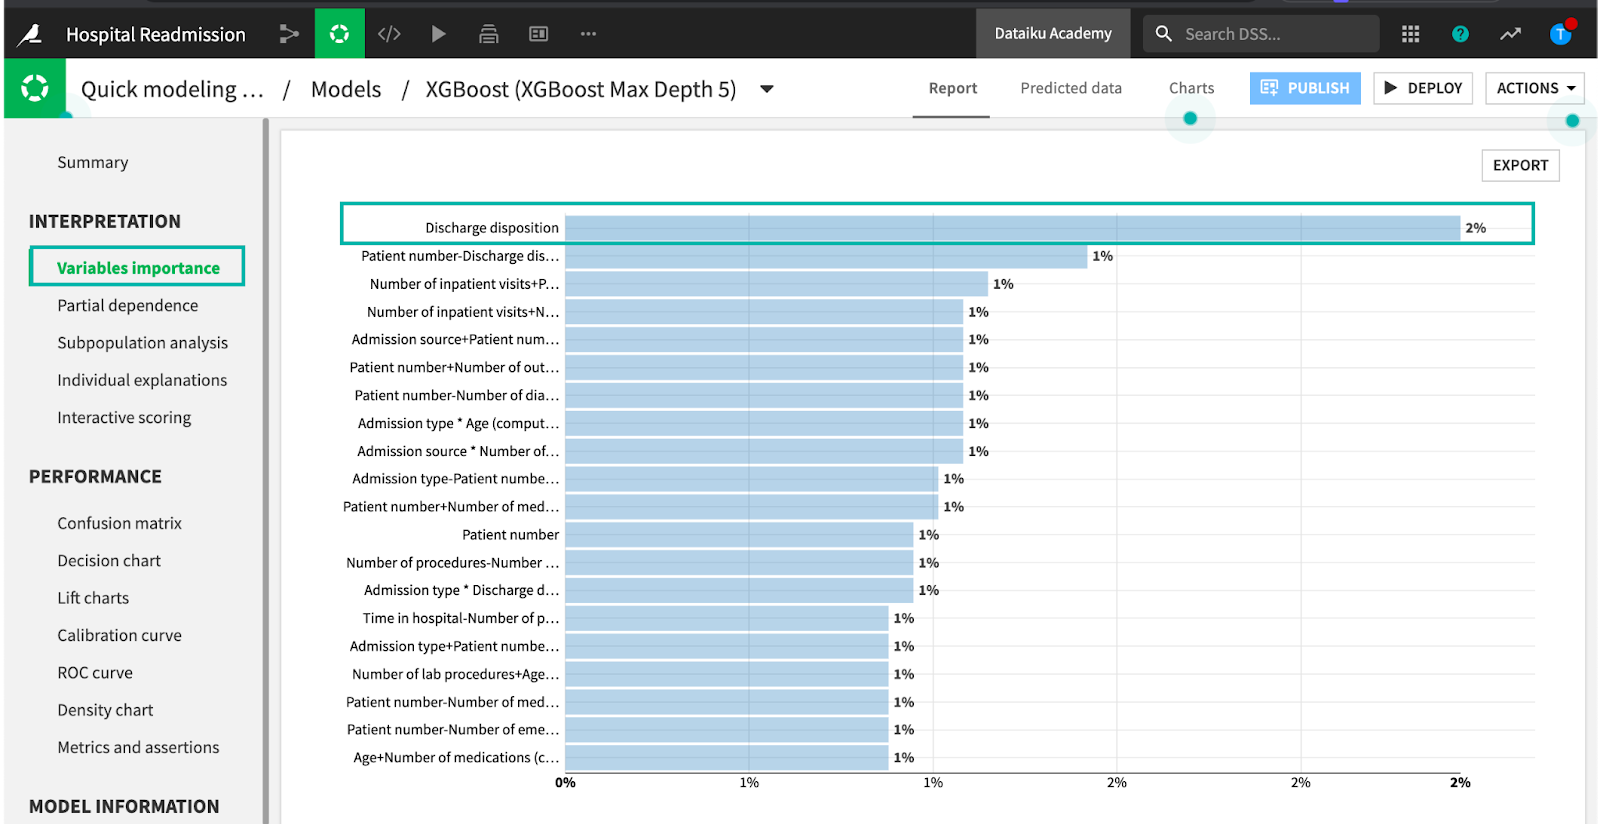
Global and Individual Explanations
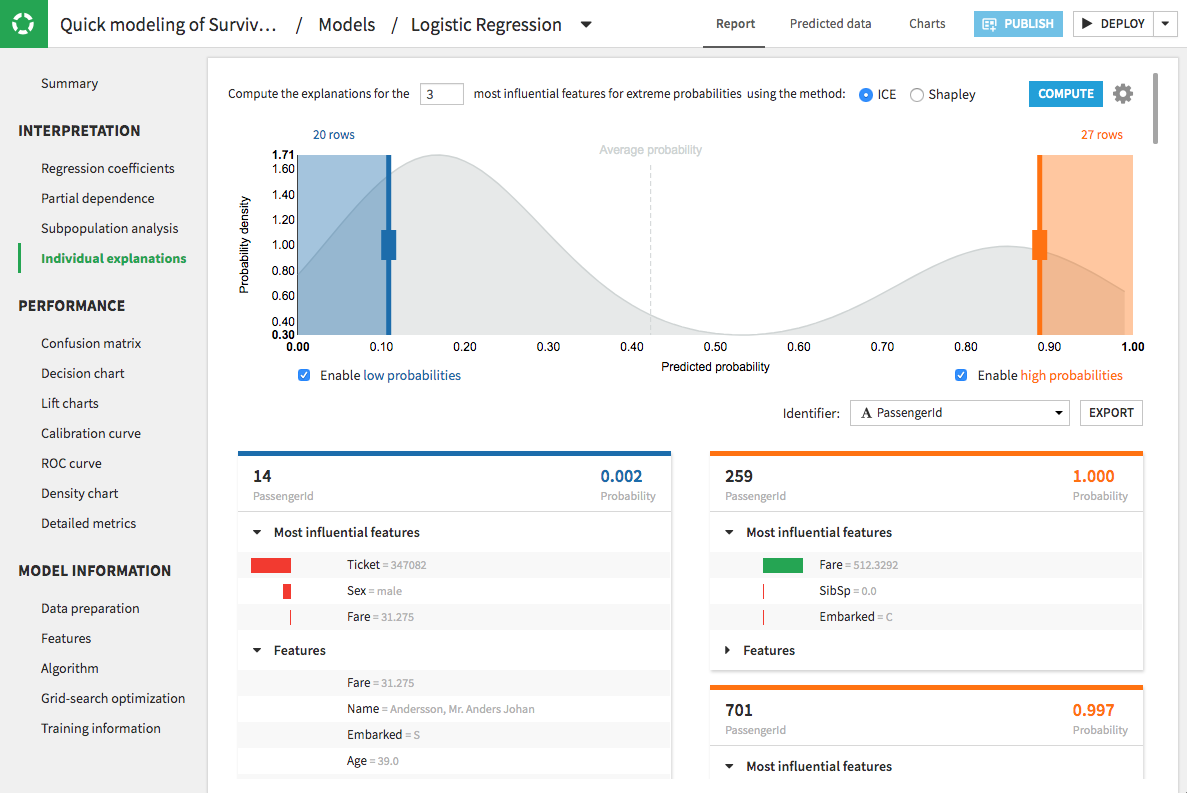
To further enhance your model interpretability, apply global and individual explanations. Global explanations show the global feature importance of each variable to the overall model. Here’s an opportunity to visually discover if sensitive variables such as race, gender, or other have suspiciously high influence on the model. Individual (row-level) explanations can be thought of as a set of feature importance values that are specific to a given prediction.
It is important to be able to generate these explanations both during model build as well as at scoring time. Some additional tools come into play here. The fastest and simplest way to derive individual explanations is computing the difference between the prediction and the average of predictions obtained from switching the feature value randomly, generally referred to as the ICE method. Shapley attempts to explain the impact of features on an individual output from a machine learning model (i.e., why one person was denied a loan) against how those features impacted a comparison group. The higher the Shapley value, the more the feature impacted the output.
Counterfactuals
Ferenc Huszár, Senior Lecturer in Machine Learning at the University of Cambridge, says counterfactuals are “a probabilistic answer to a ‘what would have happened if.’” And while not directly related to model interpretability, can be a helpful tool in achieving more Responsible AI.
Counterfactuals get us closer to causality, which is fundamental to understanding fairness and bias and achieving model interpretability. We innately question outcomes in terms of counterfactuals when we search for the reasoning of an adverse machine-based decision. For example:
- The algorithm denied my credit application, so I must have an adverse event on my credit report, or my credit usage is too high. What if I hadn’t taken out that home equity loan to renovate the kitchen?
- My doctor said the results from my X-ray didn’t show anything, so he didn’t prescribe pain medicine. What if I was a white male?
Counterfactuals deserves a separate blog and we don’t have enough time to explore the topic here. But the implicit hope expressed in our interrogation of models is that there must be an explainable cause since no one wants to be the subject of random and capricious or unfair and biased AI.
Key Takeaways
We can count on a couple of things to be true. First, enterprises will continue to pursue efficiencies, cost savings, and new revenue opportunities using AI and ML, striking a balance between white-box models and black-box models, between risk management and innovation. And people will continue to question whether they are being treated fairly by AI in the process. For now, we are closing in on model interpretability for low-complexity, supervised models. And we’ll need to continue to develop tools that provide some level of model interpretability even for complex deep learning algorithms.