


You may remember the first article in our Responsible AI in practice series, where we set the stage for the series — highlighting use cases from different industries along with actionable tips and tricks to execute within Dataiku — with a healthcare use case. Well, we’re back for round two and ready to discuss bias in marketing personalization (think targeted advertisements and dynamic pricing).
Yes, it’s true that even when checking data for potential biases, models can still ultimately be biased. Before prescribing any resolution to the problem of model bias, model builders (such as data scientists) need to learn more about how biased a model is by measuring some fairness metrics. The good news is Dataiku makes this process easy with our model fairness report, but how can you make sense of it and know which fairness metric to use for your use case? In this article, we’ll provide a high-level overview of the marketing use case along with helpful information on measuring model fairness in Dataiku.
Use Case #2: Biases in Personalized Ads and Dynamic Pricing
According to McKinsey, personalization can reduce acquisition costs by as much as 50%, lift revenues by 5-15%, and increase marketing spend efficiency by 10-30%. There is always the underlying risk, though, that the automated systems behind these marketing personalization campaigns perpetuate harmful biases.
This example from the Harvard Business Review outlines, with the example of dynamic pricing and targeted ad discounts, if (and how) biases may arise if the prices end users pay are decided by an algorithm (i.e., if a company wants to use historical data to train said algorithm to identify the customers, who will be the most receptive to price discounts?). The article states that so long as the customer profiles you feed into the algorithm contain attributes that correlate with demographic characteristics, it is highly likely that the algorithm will end up making different recommendations for different groups.
In the article, the authors discuss the problem of targeted advertisements and pricing that inadvertently give better discounts to residents in high income areas. A similar form of discrimination could occur across different age groups. What if the historic promotional data is not well balanced across various age groups and there is more information on promotional responses for customers in the 18-55 age ranges versus those over 70? A model built on this data will not perform as well for the 70+ cohort and, as a result, fail to target customers who would actually use the promotion and create a pricing inequality between different populations of customers.
Do It in Dataiku!
As mentioned earlier, companies frequently send coupons and promotional discounts to customers to encourage spending and promote loyalty. In order to target these promotions most effectively, marketing teams will use historic redemption data to determine which customers to send new coupons to. Historic data is always biased — in this case, among different age groups in a given population. These biases will naturally reflect themselves in the model we build, so we need a way to measure and assess the fairness of a model.
Dataiku’s model fairness report calculates four widely accepted fairness metrics for binary classification models. It is not mathematically possible to satisfy all of these metrics at the same time, which means that we need to choose a single metric to prioritize for fairness. Which metric is most relevant will depend strongly on the intended use and impact of the model. In order to use the fairness report effectively and understand the various outputs, we’ll walk through the meaning and tradeoffs of each metric using an example from the world of targeted advertisements.
A common belief in the retail world is that younger and middle age clientele are less likely to be loyal to a single store, and thus will use coupons more frequently than their older counterparts. As a result, marketing teams will prioritize sending coupons to shoppers within key age groups such as 18-35 and 36-55.
What does this look like in practice? Imagine a team at a large e-commerce retailer decides to send promotional discounts to shoppers, but favors sending them to younger age groups. After seeing the success of the campaign, they decide to use the prior redemption status as a target to determine who should receive future promotions and coupons. Below is the distribution of correct predictions by the model for each age group.
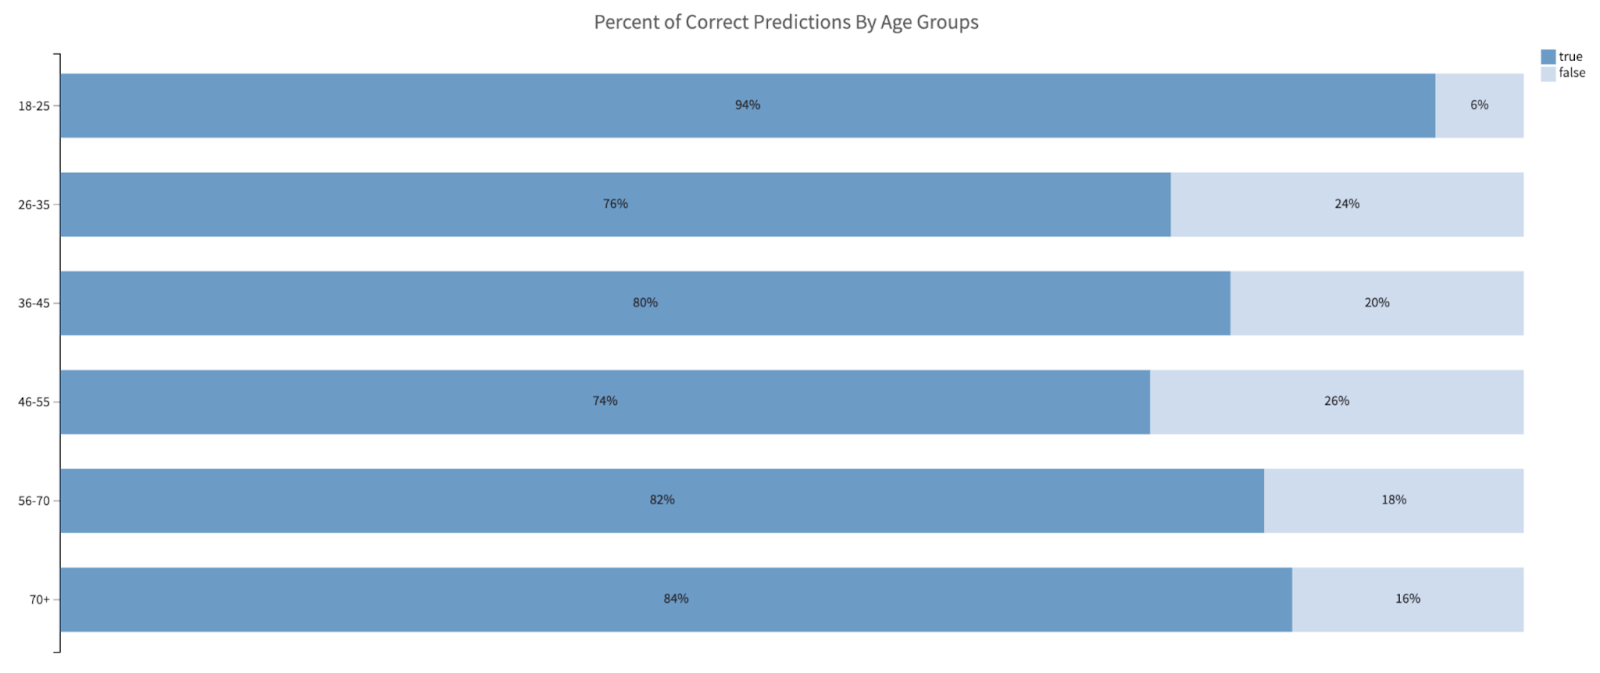
We can see that the model correctly predicts redemption status for the 18-25 group most often, with an average of 80% accuracy rate for the other five age groups. The marketing team may argue this model performance is good and that they can move forward with the model. However, given the biased nature of the input data and a tendency to send fewer promotions to older demographics, we want to make sure this model is fair. To do so, we can use the fairness report to generate four different types of metrics for the model. Below are the results of the report.

1. Demographic Parity
First up is Demographic Parity. This metric measures whether the rate of positive predictions (Positive Rate) is equal between the sensitive and advantaged groups. The measure does not consider whether the positive predictions were true or false, only the rate of positive predictions for each group.
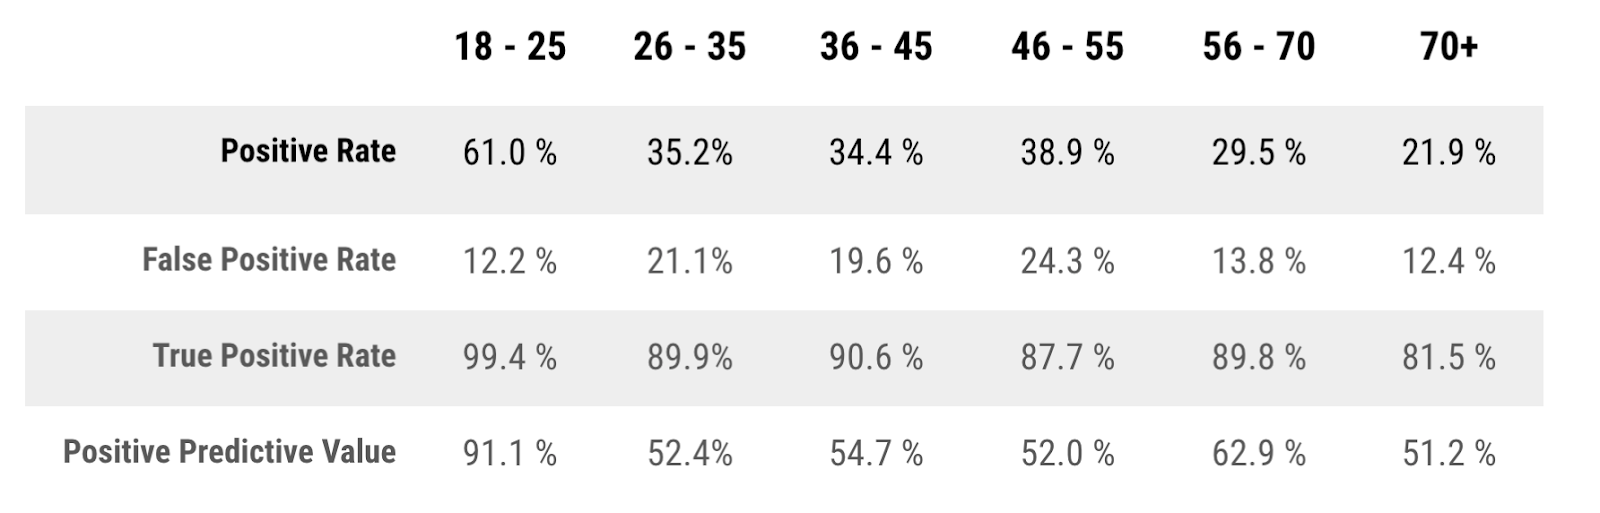
In this case, we see that the youngest age group has the highest rate of positive predictions at 61%, while the middle 26-55 demographic ranges between 34 and 38%. The two oldest groups of shoppers have the lowest scores, with only 21% of the 70+ group receiving a positive prediction. If the marketing team wanted to ensure the number of positive predictions (and in turn coupons distributed) was equal across every demographic, this measure would indicate the model is unfair and not predicting the outcome with parity.
2. Equalized Odds
This metric measures whether the true positive rates (TPR) and false positive rates (FPR) are equal between the sensitive and advantaged groups. It assesses both the classifier’s ability to correctly predict positive values and the likelihood of incorrectly predicting positive values.
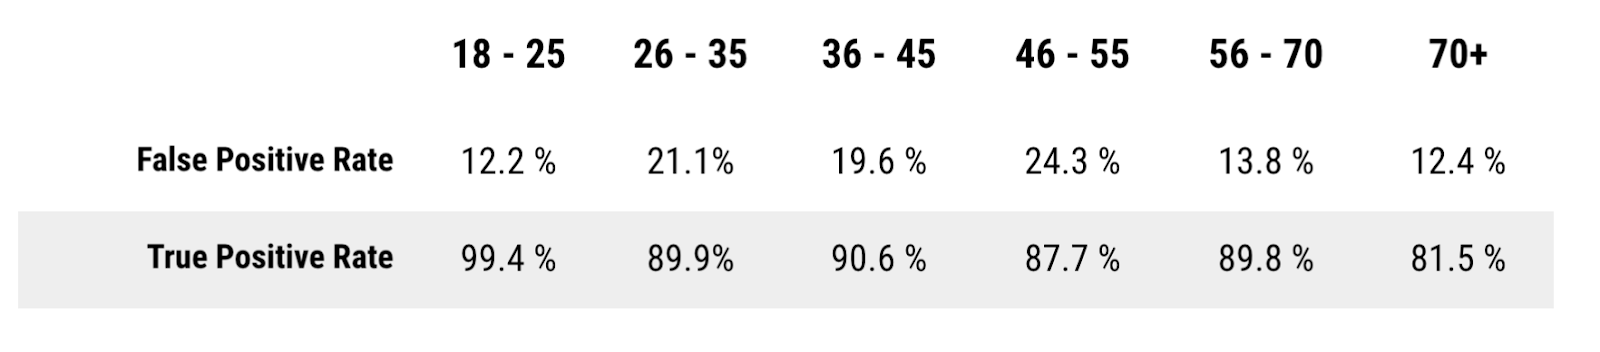
Here we can see that for our population of interest, the FPR differs quite a bit between the various subgroups. At the same time, there is a large difference in the TPR, with about an 18% difference between the 70+ group and the 18-25 age group. This means that the model incorrectly classifies more people who would have redeemed a coupon in the subgroup that is often discriminated against.
Since the overall FPR varies widely across most groups, using this model means that the marketing team may spend more budget than needed to send coupons that will be redeemed. Additionally, with the unequal distribution in the TPR, the overall spend would not be well distributed enough to guarantee a maximum response rate while continuing to discriminate against people that would actually use the coupon.
3. Equality of Opportunity
This metric is a relaxed version of ‘Equalized Odds’ that only measures the TPR between the sensitive and advantaged groups. Equality of Opportunity implies that the model correctly classifies customers who will redeem the coupon equally across all subgroups — thus giving those customers equal opportunity to receive a coupon. Optimizing the model to create equal opportunity across different groups could result in a more disparate FPR, but at the benefit of increasing the number of customers who correctly receive the coupon. This tradeoff is something the marketing team would have to consider, especially if the relative cost of sending a coupon to someone who will not redeem it is low.
4. Predictive Rate Parity
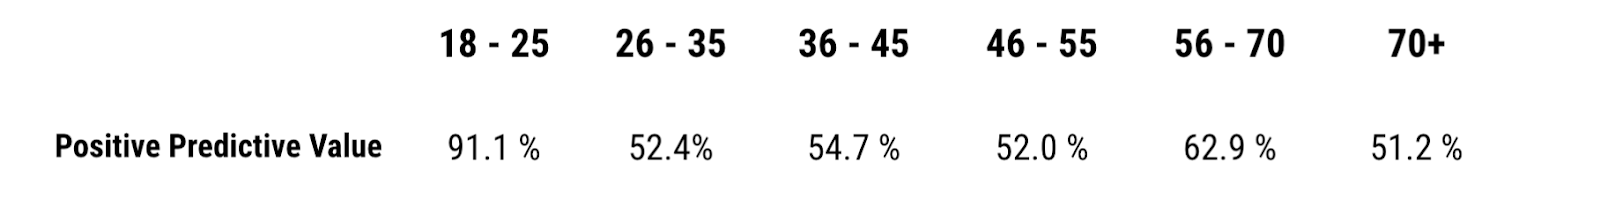
This metric measures the difference in precision between the sensitive and advantaged groups. Precision is measured as the percentage of all predicted positives (both true and false) that were actually true.
In the case of this model, the precision for the 70+ group is far lower than the 18-25 and 56-70 age groups. This reconfirms that the model’s misclassification of the positive class skews towards the most vulnerable groups, while continuing to perform well for age groups that are already not discriminated against. Optimizing the model for this fairness metric would mean focusing on increasing the number of correct positive predictions at the risk of reducing the number of true positive outcomes the model finds.
Closing Thoughts
When it comes to Responsible AI, how much metric disparity between the sensitive and advantaged group indicates a model is unfair? Like many things in this domain, it depends. In this example, the difference for most of the metrics is quite large, spanning at least a 18% difference in model performance. However, would a 5% difference in the TPR be close enough to consider the model fair? What about a difference of 2%?
These are decisions you and your organization have to make based on the tradeoffs and potential costs of unfairness. In some cases, a difference of 5% may not have a significant impact on the end users, such as in ad targeting. In others, like a variety of healthcare settings, even a 2% difference in the TPR can lead to disproportionately negative health outcomes for one group over another. Being aware of and willing to explore these tradeoffs is a critical component of Responsible AI that all data practitioners should take an active role in.