


Observability is a topic that has been floating around for a while, but are you able to clearly outline the differences between observability and model monitoring as well as understand the value of the actions behind this system of logic? In this blog, discover the distinctions and learn about the processes involved, or check out the full Dataiku Product Days session for a more in-depth description of the examples on which this blog is based:

Monitoring is concerned mainly with specific metrics while observability moves beyond this scope and is a global approach that expands through and encapsulates your entire data ecosystem.
By definition, observability is the measurement of how well the internal states of a system can be inferred from knowledge of its external outputs. The objective here is not only to know how the system is working but also to promptly identify and analyze any issues present. This involves looking into the entire business process from end to end among multiple systems and being able to point out and follow any issues that may pop up.

The Internal States of the System
As a vast topic, we need to look at observability from various angles to understand it. In this context, we will look at it from ITOps, DataOps, and MLOps points of view.
ITOps
Starting from the infrastructure, this is a layer where observability is the most mature and where there are existing tools. In this space, Dataiku can act as the observer or the observee.
As the observer, Dataiku can ingest many types of data and logs, so that its capacities can be used to detect issues, build dashboards and generate calls to action. Dataiku can effectively help you label and leverage logs, reconciling information coming from Kubernetes and other sources into a cohesive system. The platform also allows you to synchronize and cross-analyze applications and logs clearly to discover how your infrastructure is functioning as a whole.
As the observee, Dataiku offers many endpoints to allow you to fetch not only its up status but also its detailed internal metrics and the logs of its activity.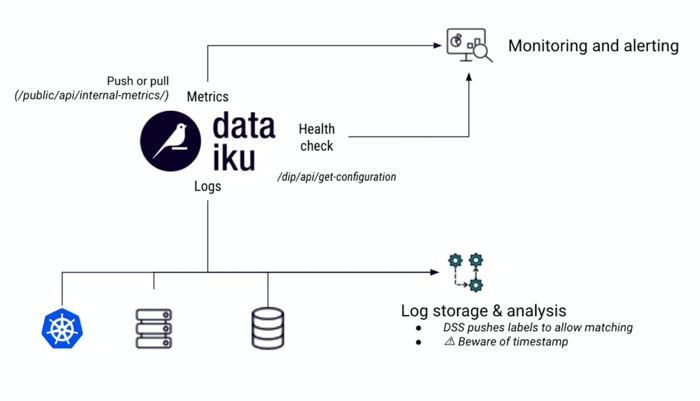
Here is an example of a specific monitoring instance in Dataiku:

DataOps
Our second breakdown of observability is DataOps, dealing with monitoring your data pipeline. Here we pay special attention to the magic triad: scenario, metrics, and checks. Dataiku offers a lot of ways to compute and surface metrics including custom metrics to build your own reports.
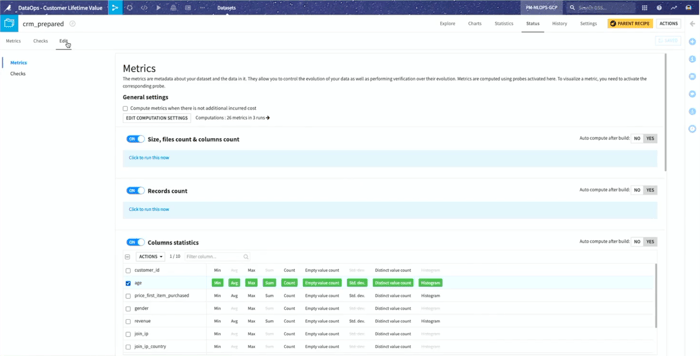
Dataiku dataset metrics is a very powerful addition to standard metrics. It is a versatile tool to build a central dashboard using any of the internal dataset models or custom metrics.
But, remember, observability is not metrics alone! When you have a problem on your hands, logs and traces, as well as reports and action, are key. In these areas, Dataiku natively offers navigation to your dataset or entire data pipeline structure as well as full visually organized logs on execution.

Then, to report and act on discoveries, you can automate the processing and alerting using Dataiku scenarios, and organize this work into valuable insights using dashboards and workspaces.
Here is a scenario example:

MLOps
Finally, let’s look at the MLOps view — exploring how well models meet project goals and serve business needs.
As an end-to-end solution, Dataiku has its own capabilities for each of the MLOps stages. Monitoring and observability are one of these main steps. Be it for Dataiku visual models, custom models exported models, or even foreign models, you can do all the model observability in Dataiku leveraging our Model Evaluation Store.

Here’s a quick look at model evaluation in Dataiku where we go from simple and actionable high-level drift metrics into a more complete and detailed understanding of how models are behaving.


Taking Action
Now that we have covered many aspects of observability in Dataiku, it’s time to move these elements into action. Check out the latest capabilities in the newest version of Dataiku to kickstart the process: https://www.dataiku.com/product/product-updates