


In this series, we explore constructing a fantasy sports roster as an example use case of an organization having to optimally allocate resources. Here in part one, we introduce the topic of optimization in enterprise contexts and begin building an end-to-end solution with data exploration and predictive analytics in Dataiku. In part two, we will dive into solving the optimization problem using our predictions and constraints.
A common scenario organizations encounter when incorporating a data-driven approach to their decision-making is the optimal allocation of resources. Enterprise optimization problems can come in the form of many different use cases. Allocating resources is essential in a multitude of industries, including logistics, manufacturing, retail, human resources, and — as we will explore in this article — sports.
The primary goal of optimization is to maximize or minimize some objective function. In most industries, this, in some shape or form, entails maximizing revenue and/or minimizing costs. Often there also exist some constraints that one must adhere to, which may include limitations on budget or business-specific considerations.
In the case of making employment or staffing decisions, the objective function that needs to be maximized is productivity. The hiring or staffing manager who is making the decision on how to best utilize human capital of course wants to choose those individuals who will perform the best (assuming this can be predicted or anticipated). However, the task is not as simple as just choosing the most productive individuals; there are various constraints that must be satisfied in the decision-making process.
Constraints to Keep Front of Mind
The first and foremost are budget and salary constraints: the most skilled people will be the most expensive, and there is a limit to how much an employer can spend overall. There are also positional constraints since any business will have a variety of needs: a technology company does not solely consist of software engineers and a grocery store does not employ only cashiers. Finally, time constraints are another factor that must be considered: nobody can work 24/7, so employers must consider who will cover which shifts.
The example of an employer hiring its workforce and optimally allocating its human resources perfectly captures the sorts of decisions that must be made when building a sports team. In the NBA for example, general managers and front offices must build a team that will perform the best (the objective function to maximize) subject to salary constraints (varying player salaries and a team salary cap), positional constraints (rostering the correct number of guards, forwards, and centers to form a cohesive team), and availability constraints (certain players may not be available to play due to recovering from injury or being exposed to COVID).
Fantasy sports allow the general public to wear the hat of a GM and build a winning roster. A fantasy basketball roster represents a microcosm of a true NBA franchise because one must maximize a similar objective function (build a team that will score as many points as possible) while also adhering to the same constraints an actual GM would (salary, position, and availability of players).
One popular format for fantasy sports is the DraftKings daily fantasy ruleset, in which one forms a team of players from any of the games happening on a given day (often called a slate). Various point values are awarded or penalized based on a player’s in-game action, such as scoring points, rebounds, assists, turnovers, etc. Each player one can choose from has a certain associated salary which is determined by the strength of the player. For example, star players may fall in the $9,000-$11,000 salary range, while low-tier players can cost as little as $3,000.
To craft a team, one must stay under a salary of $50,000, and one must form an eight-player roster consisting of a point guard (PG), shooting guard (SG), small forward (SF), power forward (PF), center (C), guard (PG or SG), forward (SF or PF), and utility player (Any Position). In this way, forming a team involves maximizing an objective function (scoring as many fantasy points as possible) and adhering to salary, positional, and availability constraints.
In our next article, we will explore solving this optimization problem to build a high-scoring team that balances the salaries of players to get the most bang for our buck. However, before we can do that we need to have an idea of how productive each player actually is. To figure out these projections, we begin with a historical dataset scraped from Basketball Reference consisting of player statistics from games going back to the 2014-2015 season.
Exploratory Data Analysis
Before we can use our dataset to build features and a predictive model, it is helpful to do some preliminary analysis of the data to know which features we expect to be indicative of performance and which ones may not have as much predictive power. We begin by doing some preliminary cleaning (removing rows with missing or bad data, splitting columns by a delimiter, etc.) and building a correlation matrix of the features. To do so, we navigate to the Statistics tab of our dataset, add a new card by clicking “Correlation matrix,” and select the features we want to include.
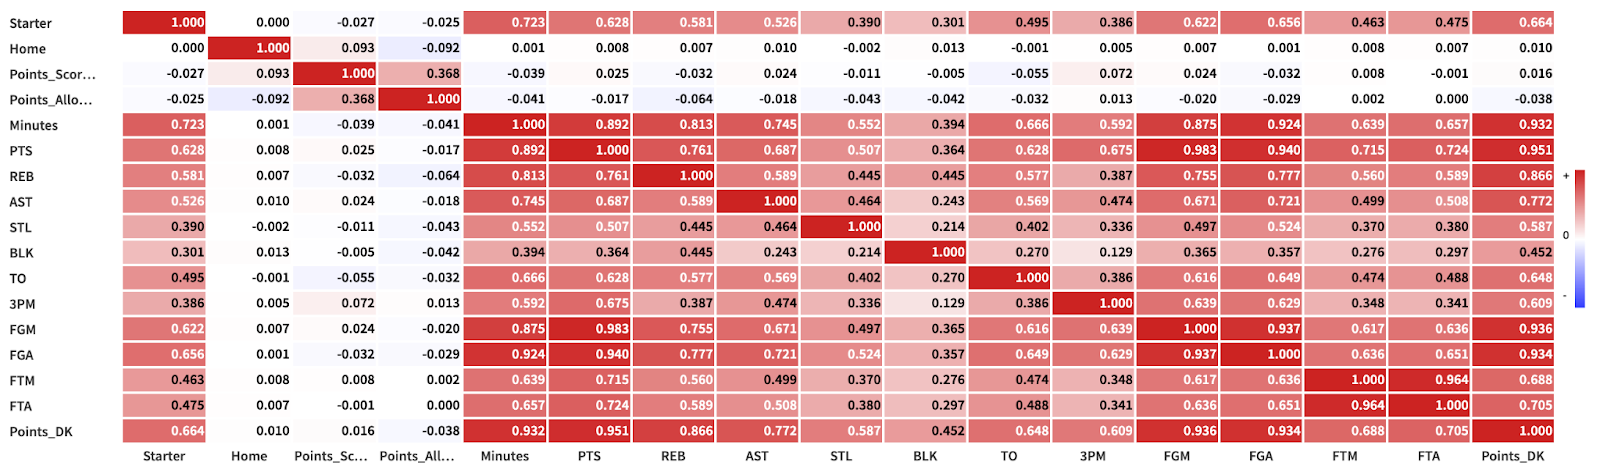
This correlation matrix shows the pairwise relationship between each of our variables, with redder values closer to 1 signifying high positive correlation (increasing one variable results in an increase in the other), bluer values closer to -1 representing negative correlation (increasing one variable tends to decrease the other), and white values close to 0 representing low or no correlation between the two variables. The diagonal of this matrix will always consist of ones, since every variable is perfectly correlated with itself. However, we can derive some important information by looking at the variables’ relationship with our target variable, Points_DK (DraftKings fantasy points), which we can examine by looking at either the last row or last column of the matrix (these will be symmetrical).
We first notice that the Starter variable, which represents whether or not the player was parting of the Starting 5 on that given night, is positively correlated with how many fantasy points the player will score. We also notice that the Home variable (whether it was a home-court game) and the number of points scored and allowed by that player’s entire team do not correlate with how many fantasy points the individual player scores. Finally, we notice that the number of minutes played and box score statistics such as points, rebounds, etc. are all highly correlated with our target, so we can later aggregate these over a player’s previous games to project how many fantasy points he will score.
It may be obvious that a player will perform better when they are a starter for a game, since starters are better than bench players in general. However, an interesting question is whether starting the game makes an impact on fantasy points scored when player caliber is held constant, particularly for lower-salary rotational or bench players filling in for injured or sick players (especially with players getting benched last minute due to COVID exposure).
We can tackle this question by running a two-sample t-test, shown below, to check whether the fantasy points scored on average are different when comparing the population of players who did or did not start. To keep the tier of players in the comparison populations somewhat consistent, we can also split our analysis into three groups based on minutes averaged (players that average 0-15 minutes are bench players, 15-30 are rotational players, and 30-45 are star players or strong role players).
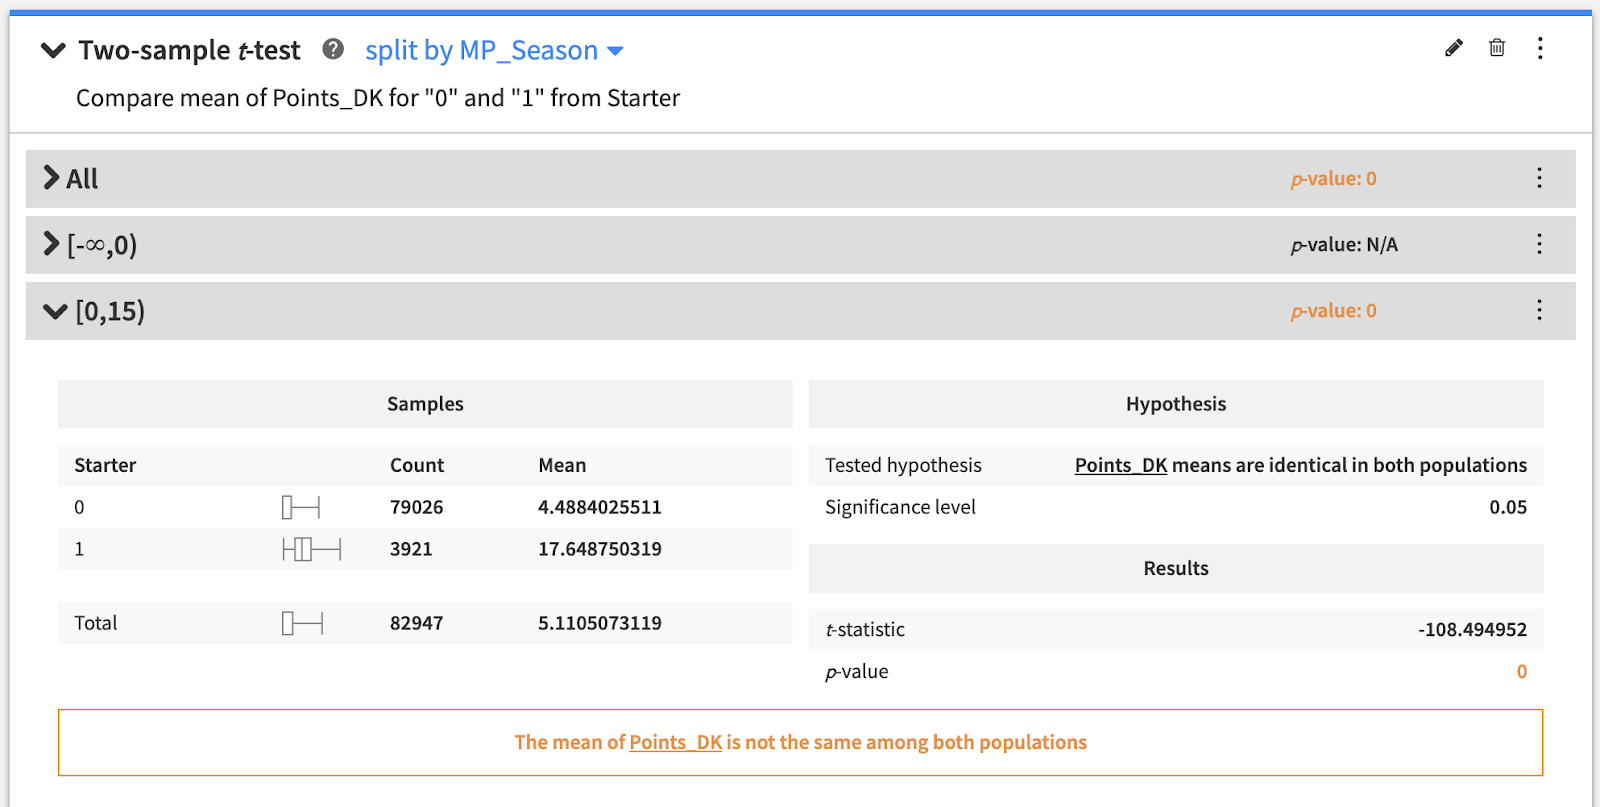
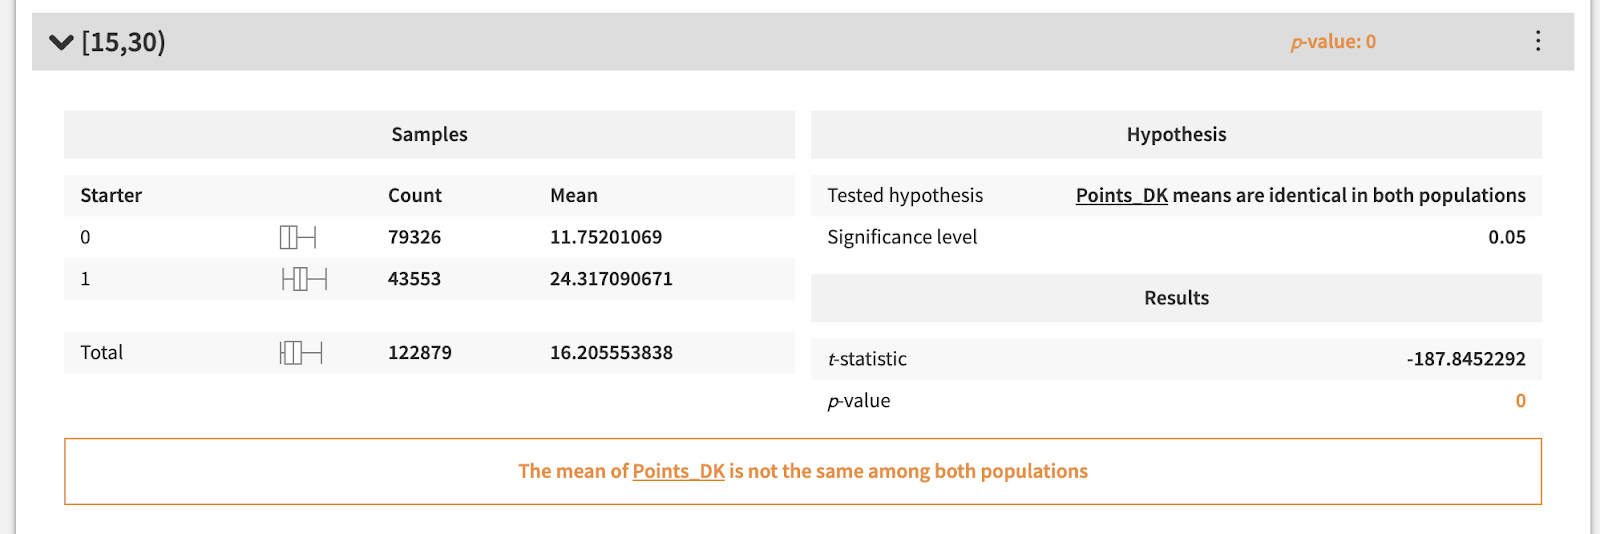
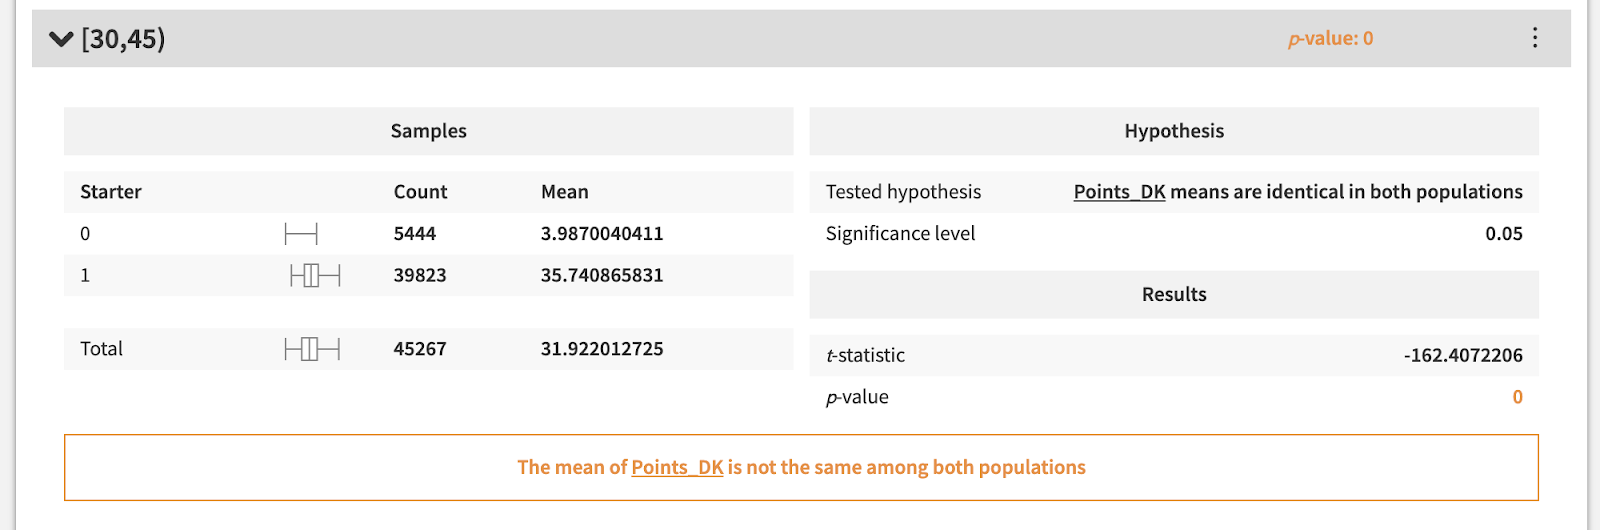
As the above statistical tests demonstrate, the average fantasy points scored between starters and non-starters is significantly different, even when player caliber is held constant. This means that the Starter feature will not only be key in our model, but also that we need to make sure this variable is up to date when making our predictions for upcoming games, since it can make or break how many points a player will score.
Data Preparation and Feature Engineering
Now that we have a better understanding of our data, we can go ahead and build features that we will incorporate in our machine learning model. In a previous article on March Madness, we explored the Window recipe to aggregate statistics over a time window. We employ a similar strategy on this dataset to aggregate a player’s performance over the course of the season thus far and over their last 10 games.
We also make sure to exclude the current row when aggregating so there is no data leakage; for example, we do not yet know the number of steals a player will have when predicting how many fantasy points they will score, so we cannot use that information as part of our prediction. For the actual aggregations, we not only use averages over each time window but for certain key features we also calculate standard deviation, floor, and ceiling. This can help to incorporate information about the risk-reward profile of a player, favoring players with high floors and high ceilings and penalizing players with low floors and low ceilings.
Additionally, we can engineer a few other features based on intuition. For example, we know that health and rest has an impact on performance, particularly for star players like LeBron James. To capture how much rest a player has, we can build features representing how many rest days a player has had over the last month and the percentage of games they have played. We can also build a feature to capture how important a player is to their team. We saw before that total points scored by a team does not translate well to individual fantasy points scored. While the size of the pie may not be relevant, building a feature to capture a player’s share of their team’s pie helps capture how consistently they will score points.
Predictive Modeling
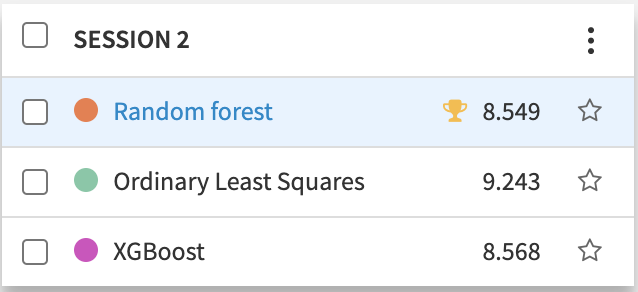
Now that we have a final dataset that includes aggregated box score statistics and various engineered features, we are ready to move on to the machine learning stage of the pipeline. With just a few clicks, we can use AutoML in Dataiku to build a few models, including linear regression, random forest, and XGBoost, in order to predict how many fantasy points a player will score on a given night. To evaluate how our model is doing, we use Root Mean Squared Error (RMSE), which gives a sense of how far away our predictions are from the actual values. In an early iteration of the model, the linear regression achieved an RMSE of 9.243, while the best-performing random forest achieved an RMSE of 8.549.
To reduce the RMSE, we can use the Design Tab in Dataiku to make some slight adjustments to the model. In the Features Handling tab, we can decide how we want to handle our numerical and categorical features. Instead of dropping rows with missing values, the model performs better when we impute these values using the mean of that feature.
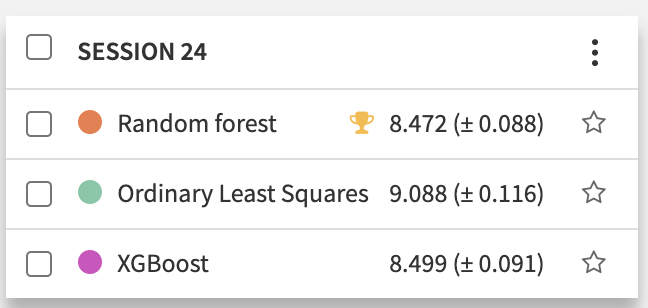
From a model standpoint, to help generalize to the test set, we use K-fold cross validation (with K=10). This gives us a confidence interval for our RMSE evaluation on the test set and prevents us from overfitting on our training set as we tune our model. We can also perform hyperparameter tuning through grid search to train our random forest using various numbers of trees and depths, selecting the best-performing parameters for our final model. After making these adjustments to our feature handling and model parameters, our random forest model achieved an RMSE of 8.472.
For context, on a given night players will typically score anywhere from 30-60 points, so being able to predict within 8.5 of our true score is quite respectable. State-of-the-art models and statistical analyses, such as a Stanford paper by Barry, et al. have been able to achieve an RMSE of 8.54 after significant effort, showing that we can achieve impressive results in predictive models in Dataiku in just a short amount of time.
In real-world AI projects, one could waste weeks or even months tuning a model, but often simpler is better. In general, data scientists only spend 20% of their time building actual models; the rest of their time is spent understanding, cleaning, and wrangling. By making it so intuitive and seamless to build a model that performs reasonably well, Dataiku allows you to dedicate more time to these key data preparation tasks and interpreting your model.
Interpreting the Model
We can interpret how the model is making predictions by exploring the Models tab in Dataiku, which provides variable importance, a confusion matrix, and even individual decision trees that make up our random forest. For example, one of the trees of the trained model primarily splits on the Starter feature.

If the player is in the starting lineup, the model knows to predict a higher value, taking many other feature branches into account to make the final prediction. This domination of the trees with the Starter feature validates our original data analysis and statistical tests. The ability to interpret how our model is “thinking” to corroborate our own exploratory analysis gives us more confidence in our projections than if we simply threw a black-box model at an unfamiliar dataset.
In this article, we have introduced the concept of an enterprise optimization problem and begun to build an end-to-end optimization solution in the domain of daily fantasy sports. So far, we have leveraged historical data and AutoML in Dataiku to build a model that predicts how productive a player will be on a given night. Now that we have an idea of how many points our players will score and their salaries, we can use this information to construct a strong team just like an employer would want to use their projections of employee productivity and salary to make hiring and staffing decisions. In the next part of this series, we will explore the most exciting part of optimization: maximizing the objective function to building our player roster.