


284 games and 43,422 plays later, the 2022-23 NFL season recently came to an end in Glendale, Arizona. The Kansas City Chiefs defeated the Philadelphia Eagles 38 to 35 in a wildly entertaining Super Bowl LVII. It featured the highest-scoring offenses in the NFL, elite quarterbacks dueling late in the fourth quarter, and an elevated Rihanna performing classic hits. What more could you ask for?
Television ratings and total viewership figures agreed, as 113 million viewers tuned in to this year’s game (source: Statista). This was the most watched Super Bowl since 2015, when the New England Patriots defeated the Seattle Seahawks 28 to 24 after the infamous goal-line interception (hint: run the ball).
That got us over at Dataiku thinking, what makes a great Super Bowl? Do high scoring games lead to better ratings? And, what will it take for my team to make the game next year?

Like we've done before with March Madness in basketball, FIFA World Cup predictions in soccer, college football national championship predictions, and Naomi Osaka's press conferences in tennis, we wanted to take this opportunity to try to answer some of these questions with data (and showcase how Dataiku's Everyday AI platform can help).
Although this post highlights lots of Dataiku functionality, you don’t need to be familiar with the product to follow along. Let’s dive in!
Accessing & Analyzing Data
Whether you’re tasked with optimizing product pricing strategies, improving demand forecasting, predicting machine failure, or answering questions about the previous NFL season, Dataiku simplifies the process to work with data and generate insights.
Getting access to quality data is a common challenge for data practitioners and slows down the ability to rapidly experiment with new projects. With Dataiku’s available connection options, you can quickly access your data where it lives and start to explore it in minutes, not weeks.
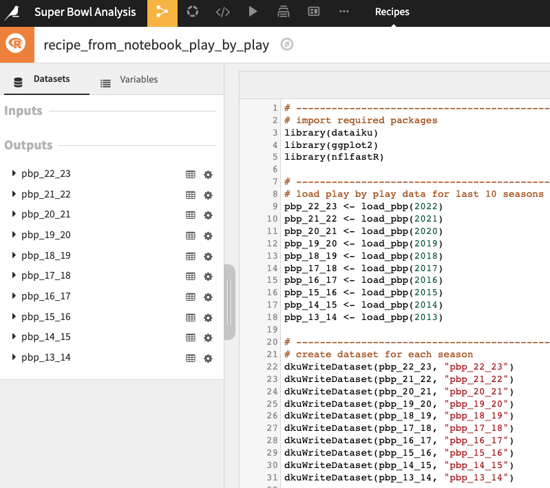
If you work for an organization that frequently analyzes NFL data, then you might already have this stored in a database and could simply connect Dataiku to access it. For this project, we decided to grab play-by-play information from a popular repository for football data and related functions, nflfastR. With just a few lines of R code, we pulled in every play from the last 10 NFL seasons and created 10 distinct datasets to analyze those further.
Now that each season’s play-by-play data is ready, we can jump into the dataset for the 2022-23 season and start to review for data quality. In clicking on the “game_id” column, it shows 284 distinct records and games with the highest number of plays. The NFL played 271 regular season games (one canceled in January), plus 13 playoff games, so this checks out.
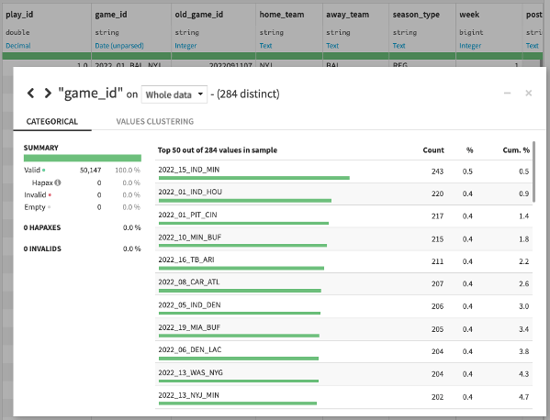
Pulling these metrics with a few more lines of code is certainly an option. Exploring these datasets visually, however, provides Dataiku users with a more comprehensive view of the data, its overall quality, and even suggests recommended next steps (e.g., removing duplicates or changing column storage type).
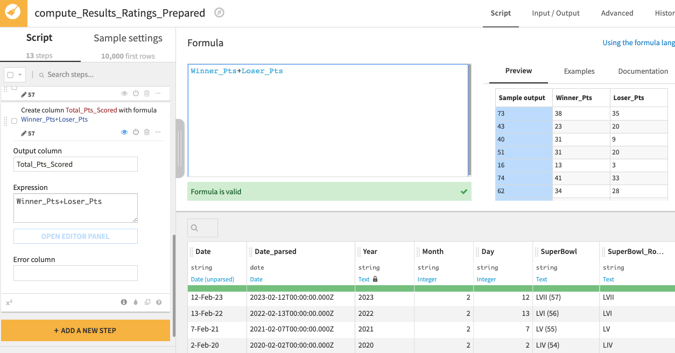
We also pulled in TV ratings and used Dataiku’s prepare recipe (with over 100 available processors) to clean up the dataset and create new columns that will be helpful for this analysis.
Now that we’ve acquired some data and had a chance to look through it, let’s move on to other cool aspects of Dataiku and dive into some Super Bowl analysis.
Collaboration Between Data and Domain Experts
Dataiku strongly believes that for organizations to get the most value out of data initiatives, they need to involve those who know the business best. This doesn’t mean that we think every manufacturing process engineer, marketing expert, or NFL coach needs to learn to code. Rather, they should have the opportunity to be included in exploring data, illustrating domain-specific insights, and driving the success criteria for how data products will be utilized in the real world.
In this example, a data analyst might kick off the project by writing some R code. Once these play-by-play datasets are accessible in the platform, however, anybody who knows how to use Excel can analyze data in the same Dataiku project. Monthly meetings with business stakeholders are now replaced by real-time collaboration, live discussion in the platform, and an accelerated way of driving value through Dataiku projects.

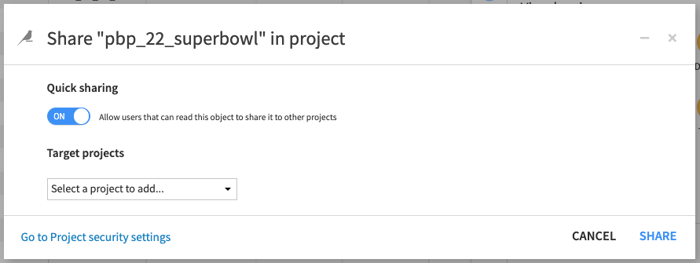
Dataiku users also benefit from the ability to leverage their teammates’ work. Say there’s another data scientist on the team who wants to dive deeper into a quarterback comparison for the Super Bowl. Rather than starting from scratch, they can take an existing dataset and create a new project with it in just a few clicks. An added level of visibility of work performed in the Dataiku platform leads to self-service analytics, but with the right amount of governance, as dataset sharing can be controlled through appropriate security measures.
In sports, the domain experts are the coaches and players, while the data experts are the analytics staffers that support game day decision-making and other operations. One noticeable trend in the NFL is an increase in fourth-down attempts. If you’ve watched a game recently, you likely heard announcers talking about the “analytics” side of going for it, instead of punting.
As grandiose as that can sound, it’s just a measure of efficiency and comes down to basic statistics. Each play has an associated metric, expected points (EP), which describes how many points, on average, a team is expected to score on a possession given the game state (field position, down & distance, time remaining, etc.). Successful plays that result in a higher chance of scoring then add to the likelihood of a score. So, the expected points after the play, minus the expected points before the play, gives each play an expected points added (EPA) value.
When deciding on a fourth down attempt, coaches weigh the impact of a successful conversion (which results in a higher EPA value) against the risk of not converting and putting their defense in a spot that might add to the likelihood they give up points. Most teams have dedicated personnel feeding this information to coaches in real-time. Whether or not that coach chooses to listen and adapt accordingly, well, that’s often how games are won or lost.
No one needs “analytics” to tell us that punting is boring, and no coach embodied that more than Philadelphia's Nick Sirianni. The Eagles attempted and converted the most fourth downs of any NFL team this season. The Chiefs, on the other hand, were towards the bottom of the league in this category. That may be due to the fact that their offense was so efficient it didn’t need to convert fourth downs. Despite this stark contrast, the Chiefs and the Eagles ranked first and second, respectively, in points per game.
Comparing Super Bowls: What Do We Find?
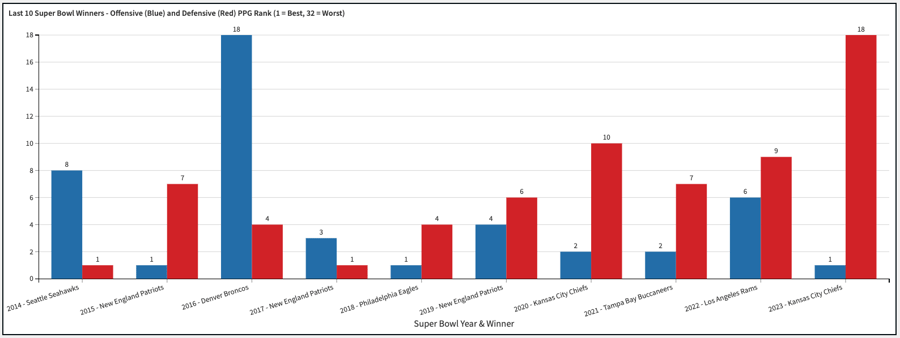
High scoring offenses? Check. Teams that rarely punt? Check. The 2023 Super Bowl matchup had all the makings of an exciting game. Well, what about the participants from the last 10 Super Bowls — were they also near the top of the league in scoring points? After looking through the data, the answer is a resounding “yes.” Of the past 10 NFL champions, every single team except for one (the 2014 Denver Broncos) ranked in the 10 for scoring offense. All but three of those teams were in the top five. No surprise here — points matter!
Now here’s an interesting stat: The last 10 Super Bowl losers actually had a better average scoring rank than the winners (3.6 to 4.6). Similarly, all but one of the Super Bowl losers ranked in the top 10 for scoring. It’s pretty evident that to make the Super Bowl, teams need to be able to score points. Nineteen of 20 Super Bowl participants since 2014 ranked in the top 10 for scoring offense!
It’s always important to check for outliers and evaluate the context for whether or not they should be excluded from a dataset. There are two noticeable outliers in the below chart, as the 2014 Broncos (#18 offense) and 2023 Chiefs (#18 defense) have a big impact on these average rankings. Despite these metrics, they both won Super Bowls because their other side of the ball was elite. Those Broncos had the fourth best defense and these Chiefs had the best offense. If there’s one big takeaway here, it’s this: Teams need to strive for a top five ranked scoring offense or defense to win Super Bowls. Only one winner from the past 10 years, the 2022 LA Rams, did not finish top five in either category.
Now that we’ve covered some of what it takes to make and win the big game, what’s the relationship between Super Bowl ratings and total points scored? Check out the video below to see how you can create visualizations in Dataiku and uncover trends across subsections of data.
In the above video, we analyzed trends for Super Bowl ratings and viewership over the last 10 years. This is a good opportunity to call out that many other variables, such as the “star power” of a player like Tom Brady or halftime performer like Rihanna, likely impact viewership and ratings as well. Separately, we checked to see what impact the total points scored in the game has on ratings. Although we did find a slightly positive linear relationship, it was not statistically significant enough to say that more points equals higher ratings.
Super Bowl Stats, Simplified With Dataiku
Our friends at Snow Fox Data recently used Dataiku to predict the Super Bowl winner. Although their model did give the Eagles the slight nod, the expected margin of victory was only .04 points, with a 50.2% chance of winning. This was bound to be a close game and applying the Elo rating model with Dataiku confirmed that point.
There are many ways to take this analysis further and create a predictive model for Super Bowl ratings. You could assess the impact of the half-time performer and grab their total Instagram followers or number of Top 100 songs. You could perform a time series analysis of each game and track the viewership / ratings on a minute-by-minute basis. Most companies paying millions of dollars for Super Bowl advertisements likely do some form of this analysis as part of an expected return on investment (ROI) for that ad.
What will it take for your team to make the game next year? Well, you could hope that Patrick Mahomes decides he doesn’t like winning Super Bowls in Kansas City and wants to do it elsewhere. The more realistic plan, however, is that your coaching staff prioritizes scoring points and finds the right balance of aggressiveness in their playcalling. The Chiefs and Eagles were the best at that in 2023, much like the Super Bowl participants in the nine years before them.
This was a fun example of looking at some high-level data to uncover trends about Super Bowl ratings and participants. We encourage you to try Dataiku for fun projects, as well as those that will generate significant value for your business.
By simplifying the process to work with data, promoting collaboration between data and domain experts, and generating insights that are explainable to all stakeholders, Dataiku enables organizations to work together to build AI into their daily operations.