


As time has passed and the analytics & data science landscapes have evolved, so have the different breeds of data scientists. One crop of people — who may not refer to themselves as citizen data scientists — are those who are proficient at working with data, solving problems, and delivering business insights. These non-data experts use data analysis tools and techniques to gain insights from data.
So, why might someone in this group of people (read: data analysts, data-driven problem solvers, other business people) care to learn about statistics and probability for data analysis (and, eventually, data science)? Because they will be able to understand which introductory statistics concepts matter and when to use them. Plus, regardless of if they ever become an “official” data scientist or not, doing so can:
- Teach them to think differently and bring a new perspective to their analytics or data project
- Help them ask the right questions, which, in turn, helps them make more informed decisions
- Provide a different method of tackling the same problems, which may allow them to skip over unnecessary trial and error
The latest installment of our “In Plain English” blog series will provide a simple overview of key statistics and probability concepts for data analysis (and, eventually, data science) in order to make the topic more accessible to non-technical experts.

An Introduction to Key Statistics and Probability Concepts
By definition, statistics is the science of collecting, analyzing, presenting, and interpreting data. Statistics can, therefore, be a high-value tool for data-driven problem solvers, given that they are expected to gather, cleanse, prepare, and analyze large amounts of structured and unstructured data and communicate on the findings.
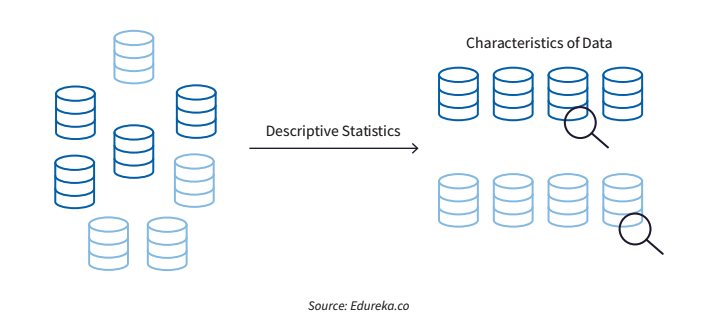
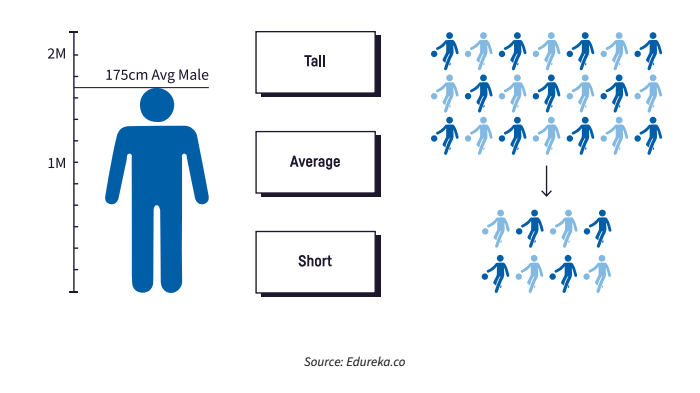
There are two main categories of statistics, descriptive statistics and inferential statistics. Descriptive statistics — as its name implies — describes the important characteristics or properties of data in order to organize it. For example, if you wanted to find the average height of players on a basketball team, in descriptive statistics you would record the heights of each player on the team and find out the maximum, minimum, and average height of the team. Descriptive statistics, therefore, can help show summary information of your data, and helps you present the data in a meaningful way.
With inferential statistics, you might find a property in a sample dataset and be able to infer that this property exists in the population from which that sample was drawn. Essentially, you can use probability theory to confidently arrive at a conclusion about a population even if you have only observed a sample. For example, we might be able to use the average height from our sample basketball team players to infer the average height of all basketball players.
14 Fundamental Statistics and Probability Terms
The terms we’ve chosen to define here are commonly used in statistics and data analysts and data-driven problem solvers may know or recognize some of them from their work. They can also be helpful when specifically applying statistics to data science and machine learning (ML). Whether you are working on a project where statistics might come in handy or you just want to discover (or freshen up on!) initial concepts, we hope you find these definitions clear and helpful.
|
Population (n) The set of sources from which data has to be collected. It has some parameters such as mean, median, mode, and so on. |
Sample (n) A random subset of the population. It can be used to estimate the parameters of the whole population. |
|
Variable (n) Any characteristics, number, or quantity that can be measured or counted. |
Parameter (n) A quantity that indexes a family of probability distributions (i.e., the mean or median of a population). Parameters are numbers that summarize data for an entire population, while statistics are numbers that do so for a sample of a population. |
|
Regression (n) A prediction method whose output is a real number, that is, a value that represents a quantity along a line. |
Probability (n) A numerical measure of the likelihood that a specific event will occur. Probability uses a scale from 0 to 1, with values near 0 indicating an event is unlikely to occur and those near 1 indicating it is likely to. |
|
Probability distribution (n) A function that describes the values and likelihoods that a variable can take within a given range. |
Sampling distribution (n) A probability distribution for a sample statistic obtained from a number of samples drawn from a specific population. |
|
Hypothesis testing (n) A method for testing how accurately a model based on one dataset predicts the nature of other datasets generated using the same process. |
Statistical significance (n) In hypothesis testing, a result is said to have statistical significance, or be statistically significant, if a relationship between two or more variables is caused by something other than chance. |
|
Null hypothesis (n) A general statement that states there is no relationship between two phenomena under consideration or no association between two groups. It is denoted by H0 and believes the results are a result of chance. |
Alternative hypothesis (n) A statement that describes that there is a relationship between two selected variables. It is denoted by H1 or Ha and believes the results are a result of real causes. |
|
P-value (n) A measure of the probability of finding the observed results when the null hypothesis is true. |
Bayesian thinking (n) The process of updating beliefs as additional data is collected. It says we can learn from missing data, inadequate data, and approximations. |
*Sources used for these definitions include Britannica, Investopedia, KDNuggets, and Towards Data Science.
When You’re Ready to Level Up & Apply Statistics to Data Science
Statistics and data science are highly related, but at the end of the day, they are separate entities. Within each field, though, you are using some set of data to draw observations and conclusions about the world. In statistics, you are trying to understand the correlations between observed inputs and outcomes, while data science is more about the collection of data, the design of data-based experiments, and applying statistics and ML to learn about that data.
While the questions we ask in both fields are of a different nature, statistics can be used before attacking any data science problem. Many hop right into ML first without doing any basic background steps upfront. The Pareto principle applies here, as you can usually get 80% of the output with 20% of the tools — a statistics foundation can help keep things simple.
Let’s say you’re testing multiple ML models for a customer’s specific use case. Some of the models assume specific probability distributions (the values and likelihoods that a variable can take within a given range) of input data. Therefore, as part of your job, you’ll need to be able to identify them and adjust the input data appropriately. This is just one minor example of how statistics can be embedded into everyday data science tasks.
Statistical knowledge can help you determine the difference between results that are believable and ones that likely happened at random. Like you’re used to with analytics, every data science project involves a bit of exploratory data analysis (EDA) to get to know the data you’ll be working with (i.e., summarizing or describing data samples both numerically and visually).
Many times, data scientists (and their clients) will say they have a lot of data, but aren’t sure which questions to answer or where to start to extract value from the data. Statistics can help set the foundation and help you identify patterns and insights. In a way, ML models are often asking simple statistics questions of your data multiple times, and using those answers in aggregate to make a prediction or uncover general structure.
Further, data scientists using ML models and AI systems face a serious challenge today of balancing interpretability and accuracy stemming from the difference between black-box and white-box models. Often in AI and ML, you are trying to determine how high your accuracy is or what your prediction is (which gives you a number or value) where with statistics, you are interpreting that and trying to describe where that label comes from. Statistics provides an extra layer of interpretation, helping you reinforce why you believe in a specific result.
Conclusion
The demand for data experts isn’t going away anytime soon, so even if you weren’t trained or formally educated on statistics and probability doesn’t mean it’s too late to learn, it will just require more manual work.
By familiarizing yourselves with the basic foundations of statistical analysis and probability, you will be able to gain a competitive advantage. Given that a significant chunk of data science and ML projects are rooted in data analysis, knowing these concepts will enable you to extract more powerful insights and make more informed decisions from your datasets.