Dataiku revolutionizes how companies work with their data, enabling any user — from beginners with no programming knowledge to experienced data scientists with advanced knowledge and complex data flows — to make their work more transparent and efficient.
Dataiku is designed not just for simple day-to-day ETL jobs but to be the one-stop shop for all your data preparation, transformation, machine learning, data visualization, and deployment needs — we’ve got you covered in every aspect, even in non-standard and unique situations.
However, as Dataiku facilitates the creation of complex setups, data workflows, and experimentation, there may be times when users encounter an issue and need to diagnose or debug it. So in this article, let's talk about what to do if you come across an issue (hey, it happens — especially if you’re a power user and really exploring the depths of what Dataiku can do).
We won't be covering advanced, specific troubleshooting topics and explaining how to read the logs. Rather, we will keep it high-level, covering basic troubleshooting steps and explaining Dataiku logging structure so you are clear on where to look to find a root cause and resolve the issue. Of course, I will also mention how to get a hand from Dataiku's support team and what logs to provide so the Support team can help you quickly and efficiently (should you need additional assistance, we’re always around)!
Troubleshooting Issues In Dataiku
If you encounter an issue, the error message will be displayed explaining the nature of the problem and how it can be resolved. However, sometimes in more complicated use cases, it may not be so straightforward, and you will need to check logs to properly diagnose the issue. Here is where the advanced Dataiku logging system comes into play. Let’s see where to find logs for different types of issues.
A Job Fails
You can find Job logs and download the Job diagnosis if required by navigating to the Jobs page:
A Scenario Fails
You can find Scenario logs and download the appropriate Scenario diagnosis for further troubleshooting purposes by navigating to the Scenarios page:
A Model Train Fails
You can find relevant training logs for your model by navigating to your model, opening the Model Information > Training Information tab, and downloading the log files:
Other Issues
To troubleshoot other issues, as an admin user, you can find the below log files directly from the Dataiku UI by navigating to Administration > Maintenance > Log files.
- backend.log - Log file for the main backend server
- ipython.log - Log file of the Jupyter notebook server
- hproxy.log - Log file for the Hadoop validation engine (validating Hive and Pig recipes)
- nginx.log - Log file for the web server serving the public port of Dataiku
You can also find the above files in the run folder of the Dataiku data directory. For example, if you used /opt/dataiku/data as the data directory, the logs will be in /opt/dataiku/data/run. However, generally speaking, when debugging instance level issues, our first recommendation would be to generate an instance diagnosis (especially when reaching out to Dataiku Support).
When to Reach Out to Dataiku Support from & What to Include
If you can't resolve the issue yourself with the help of the Dataiku Knowledge Base or the Dataiku Community, not to worry — we have a team of specialists (including Kim!) on hand who are more than willing to help. When reaching out to Dataiku Support, we recommend being as prescriptive as possible about the issue, including relevant screenshots, and sending the appropriate log files or diagnosis so that we can best support you and provide the quickest turnaround time. We will recap below the logs that you should be sending to Dataiku Support but also recommend checking out our troubleshooting documentation as well.
When it comes to troubleshooting different issues in Dataiku, you will generally want to be sending one of five types of diagnostic log sets or logs for deeper investigation by Dataiku Support:
- Job Diagnosis: Attach this diagnostic (see video above) for any type of issues related to a Job, most often while trying to execute or run a Recipe.
- Scenario Diagnosis: Attach this diagnostic (see video above) for any type of issues that relate to a scenario run or execution.
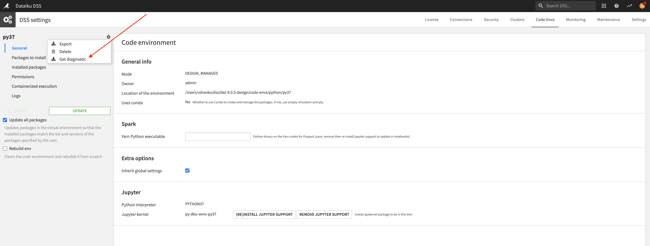
- Code env diagnosis: Attach this diagnostic for any issues related to building a code environment and/or installing a package in your code environment.

- Training logs: Retrieve and attach the corresponding machine learning train logs (see video above) for any issues related to training of a particular model that you might be facing.
- Instance Diagnosis: Attach this diagnostic (see video above) for any instance-level issue that is not covered by any of the other situations. This can include setup or configuration related issues involving connections, users, and permissions, errors related to your Jupyter notebooks, issues involving upgrades or migrations, issues with various integrations, and general performance or stability issues that you might be facing with day-to-day use of Dataiku.


