


This is a guest article from our friends at InterWorks. InterWorks is a people-focused tech consultancy delivering premier service and expertise in collaboration with strategic partners. We are trusted to empower clients with the right people and solutions aligned to their unique needs. From data management and visualization to server monitoring and maintenance, we can customize the best data and IT solutions for you.
Nothing and no one works in a vacuum. Data engineers, data scientists, and business analysts all need to work together to create and complete a project. As a data scientist, I could create the most accurate and, to me, most beautiful machine learning model to predict something, but if I can’t communicate to others what is happening or let them interact with it, it’ll be the equivalent of a parent saying, “Because I said so.” And if I can’t connect to the data that my data engineers have collected and curated or be able to run my workflows efficiently, it’ll be like swimming through porridge — it’ll get done, but it’ll be a test of patience. Dataiku has solutions to each of these quandaries.
To showcase all of these capabilities, I’ve completed a project where I am acting as an employee for MoneyWorks Bank, trying to determine whether someone is likely to default on a loan or not so that I can — as the lender — decide if I want to approve their loan request. I want to automate this and create a way for someone to be able to see the results. This project can be broken down into three steps:
- Connect to and compute using AWS.
- Run my workflow automatically/on a schedule.
- Publish to Tableau (and view information about the predictions).
Now let’s look at these steps individually.
Connect to and Compute Using AWS
Over the years, MoneyWorks Bank has collected information on all the loans we gave and to whom. Our data engineers have done a fantastic job of taking the data from disparate data sources and creating the pipeline that pushes it all to our PostgreSQL database (which is running on AWS). Having the data in our PostgreSQL allows me to do two things with Dataiku: connect to the data directly and push the computation of every step of my workflow onto that database. I no longer must live by the constraints of my laptop’s processing power!
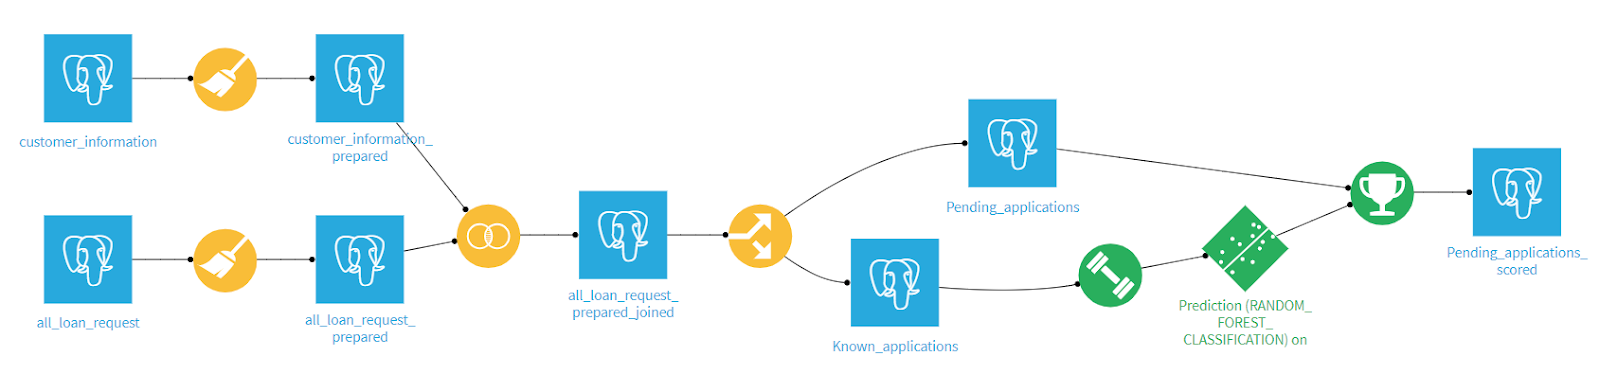
Every data source is in my PostgreSQL database, so every step's computation can be pushed down.
Run My Workflow Automatically or on a Schedule
Dataiku has a feature that allows us to create an automation scenario. These scenarios are a set of actions you define that can be triggered in a variety of ways. Want your data to update at the top of every hour? Create a scenario for that. Want to run some Python code when you upload new data? Create a scenario for that. Want to retrain your machine learning model every time a button on your web page is clicked? It’s scenario time.
For this example, I want to retrain my model every month. Creating this scenario that is triggered every month allows me to ingest any new information our data engineers have collected and stored into the PostgreSQL database over the past month.
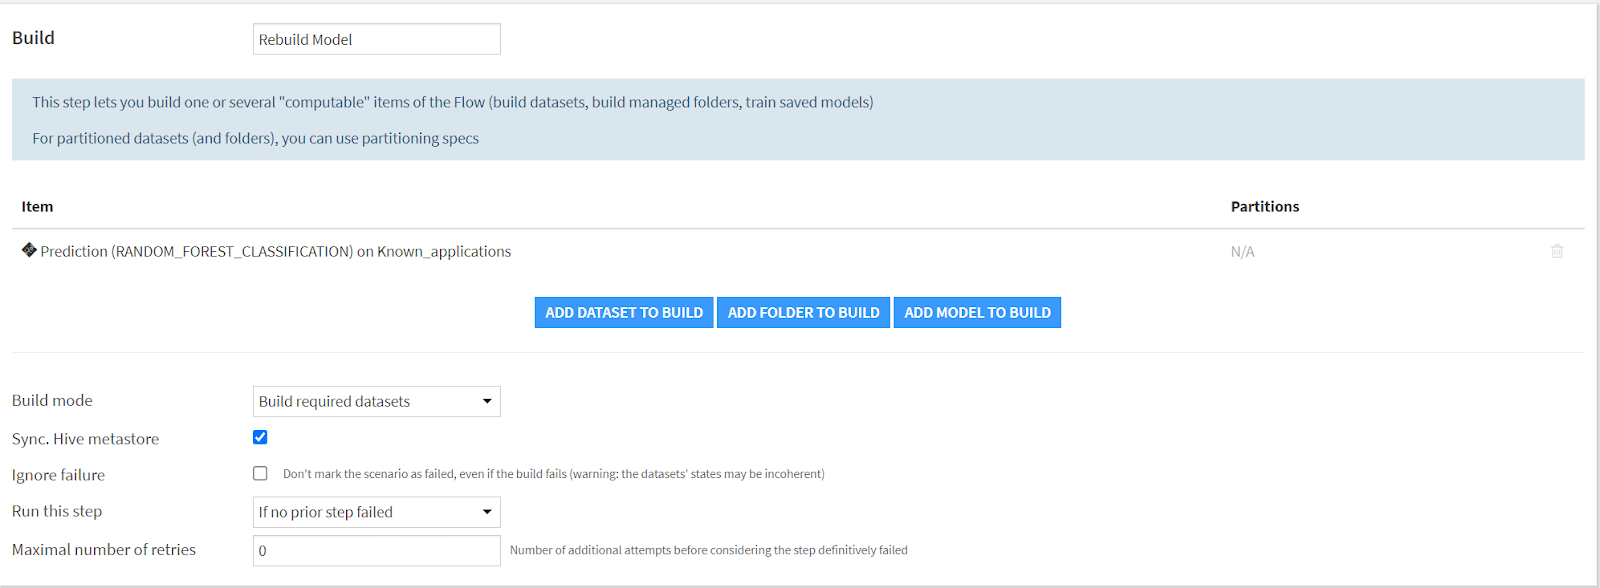
The scenario I've created to retrain and build my model
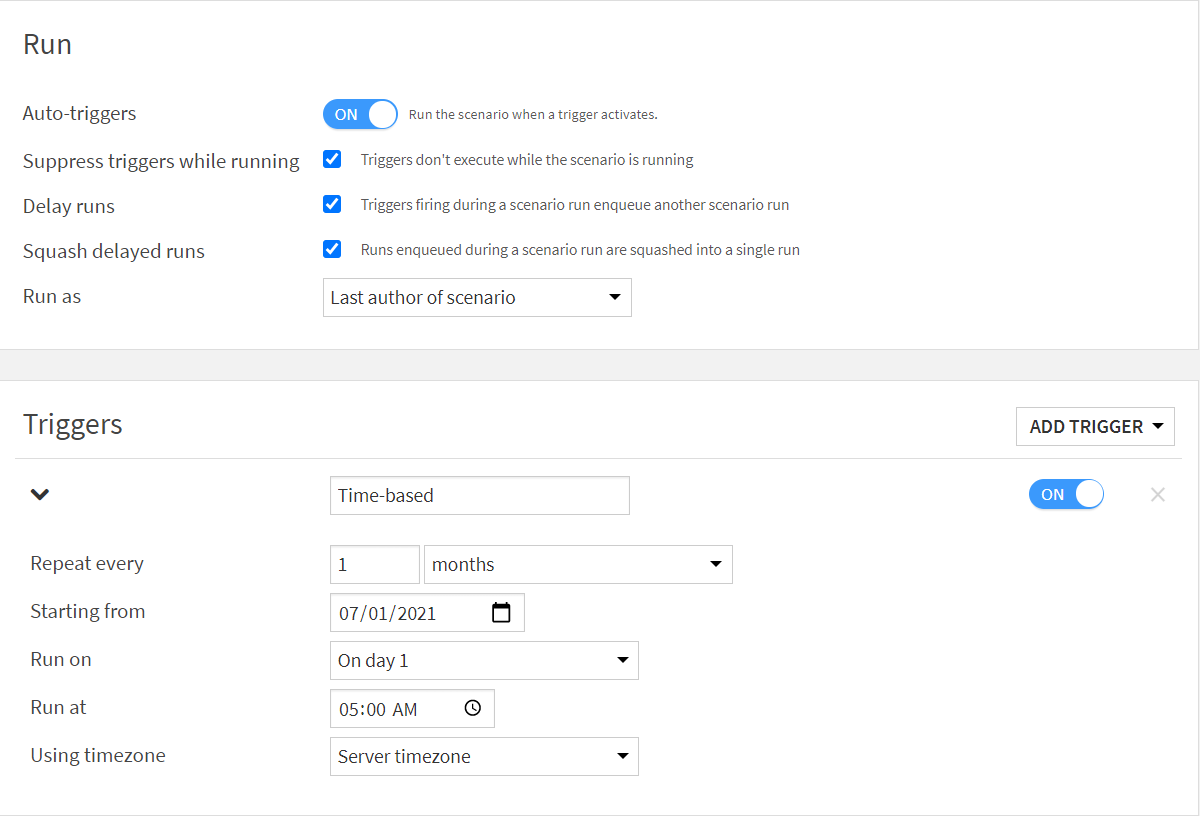
The settings to run the above scenario automatically every month
Publish to Tableau
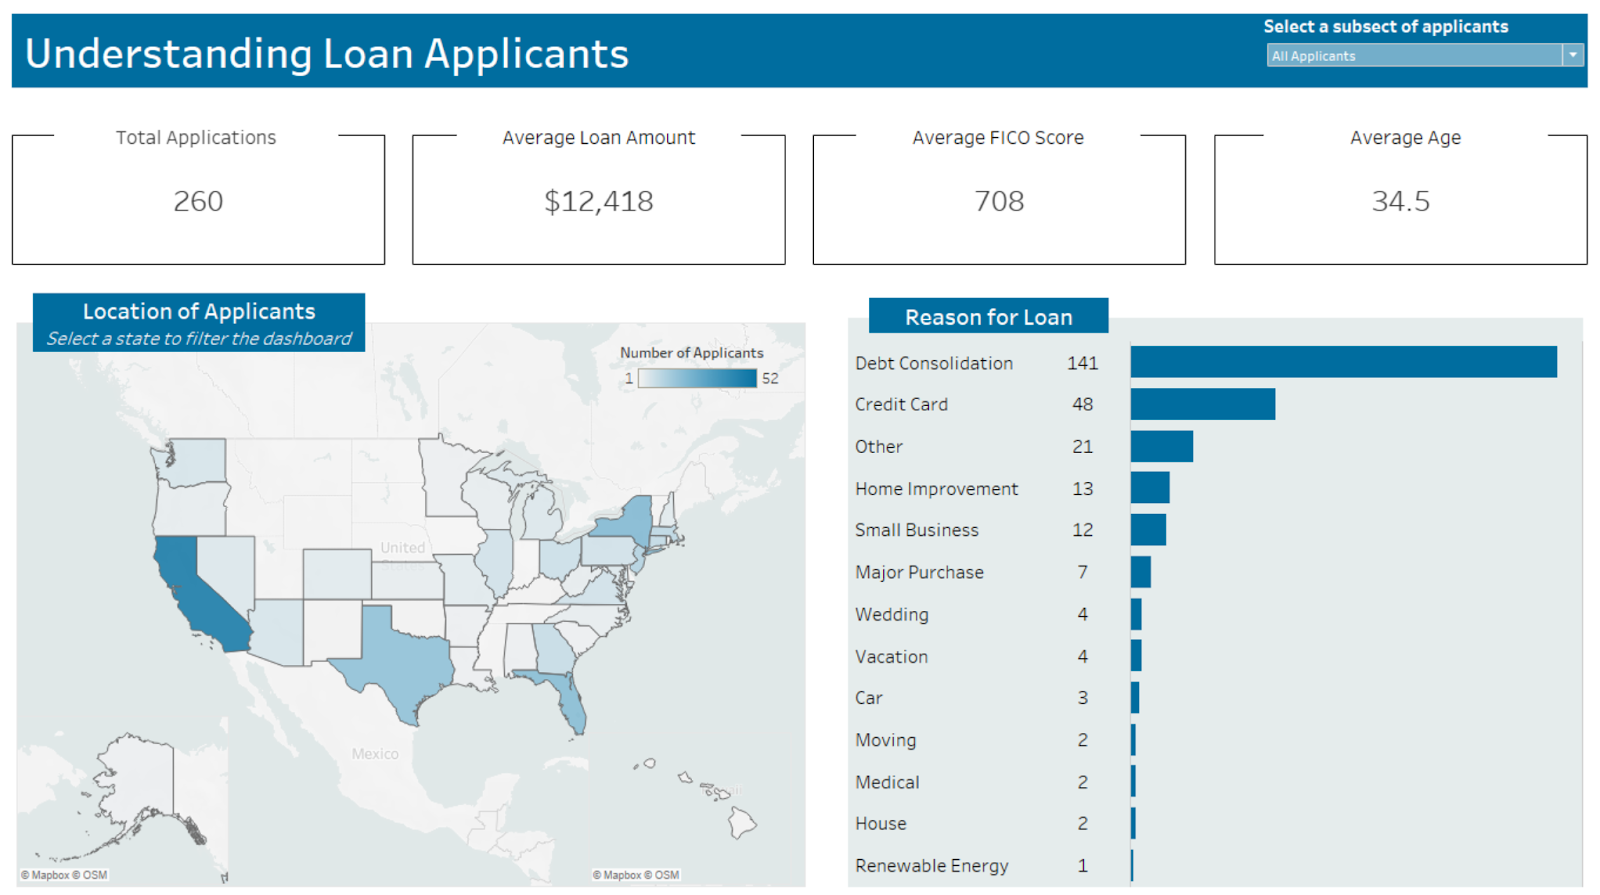
So far, I’ve accomplished almost everything I’ve wanted to do — I’ve made a workflow that is efficient and retrains based off of new data every month. But now, I need to share this with my business analysts! They need the information from the model to answer many questions: Who is most or least likely to default? Where are most of my applications coming from? Knowing the answers to these questions will help inform some of the decisions they make, from which applications to approve to where MoneyWorks should spend their marketing budget.
While there are many ways to use Dataiku in connection with Tableau, my goal is to show my business analysts information about the current applicants, divided up by who was predicted to default or not default on a loan by the model I created in Dataiku. I’m using Dataiku’s Tableau Hyper Export plugin in order to automatically publish the final scored dataset to my Tableau Server so that the dashboard I’ve created will update as soon as the new data has been scored by the model.
A Stack Built for Efficiency
Using the combination of AWS, Dataiku and Tableau — especially focusing on the amazing capabilities and plugins available in Dataiku to connect the three seamlessly — allows my team and I to work together. Between data engineering collecting and creating the data in PostgreSQL, me as a data scientist ingesting that data and building a prediction model in Dataiku, and the business analysts being able to see and understand the predictions in a visual manner in Tableau, our business decisions can happen quickly and efficiently. A true win-win.