


I’m Jacob, a 16-year-old computer science enthusiast who has just completed a one-week internship with Dataiku. Sound familiar? It should, as I was the one behind the facial recognition project from earlier this year. For my second round of work experience here, we needed a new project idea. Once we realized just how many plants had gradually snuck into the office, ideas began to formulate in our heads…
The Plan
The idea that we settled on was to make a device that can monitor the conditions of the plants in the office to tell you if they are being kept in the right conditions. This is especially important in an office where plants are often introduced as an aesthetic feature, and a brown, wilted plant is not very aesthetically pleasing!
The Hardware
For this project, we used an Arduino MKR1000 as the brains of the operation. This small board is no larger than a stick of gum but comes with full Wi-Fi connectivity to allow us to beam data out to wherever it needs to be stored. To measure the conditions of the plant, we would need a trio of sensors plugged into the Arduino to detect soil moisture, light, temperature, and humidity.
We figured that these were most likely the biggest factors in your plant’s health and also the most crucial, especially in an office environment. For example, the humidity in an office can often be too low due to climate control in the office, and this device will help to show that. It can also help to tell you if your thermostat needs to be turned up, or if your coworker’s plant has already been watered recently and does not need any more.
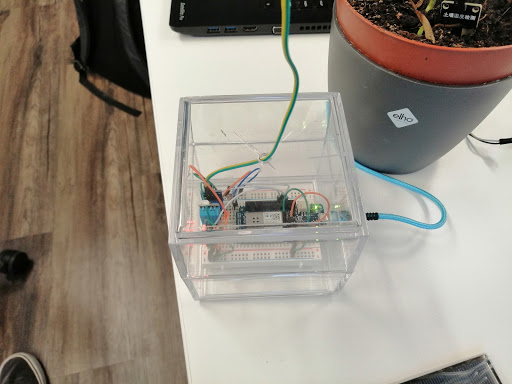
From here, we needed a way to store the data collected from the plant. Sadly, the little Arduino does not have the brainpower to store all the data itself, so it needed a companion to help it along. For this, we decided to stream the data over Wi-Fi to a database for storage in the cloud. With that out of the way, it was time to get to the good bit.
The Data Science Bit
After starting up the sensors, it was time to do something with the information that these sensors were giving us. Our end goal was to have a complete health report for your plant available to you so that you can see what aspects of the plant need adjusting in order to meet optimal conditions.
To achieve this, we used Dataiku to add checks to our datasets that would run as often as the sensors took measurements — which was every five minutes. This would allow us to check whether the plant was always under the correct conditions and would let us know if anything needed changing.
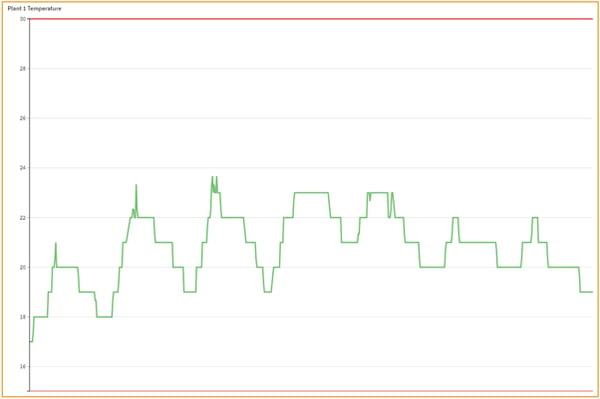
Here, we can see the temperature graph. As long as the temperature remains within the red boundary lines, the plant is happy and comfortable.
Dataiku allowed me to then organize graphs for each of the four measurements we were taking onto a dashboard so that we could easily check up on the plants as well as check the results of the tests that would check if the conditions were okay.
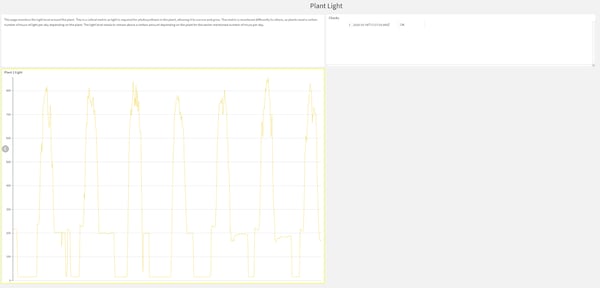
This is an example of what the dashboard pages look like. They feature a live feed of data which is represented in a graph, and your checks tell you whether or not your plant is getting the right amount of each metric. It also includes a helpful description of what each feature is and how it is important.
One unexpected discovery we made when launching the project was that one of the plants was over-watered, which appeared on our dashboard.
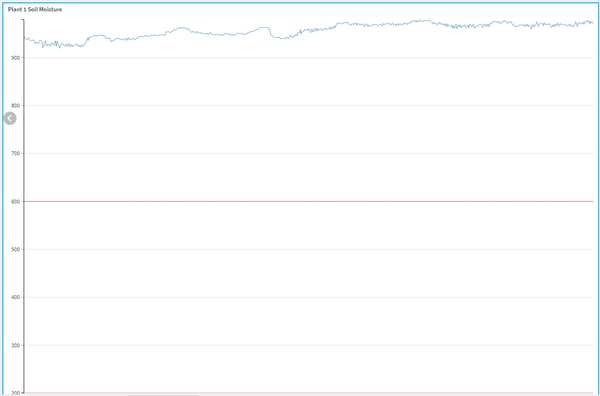
This distress call from the plant was a good sign that our program was working properly, however it was not the best sign for the plant itself.
However, this was not the end of it.
The Solar Power Part
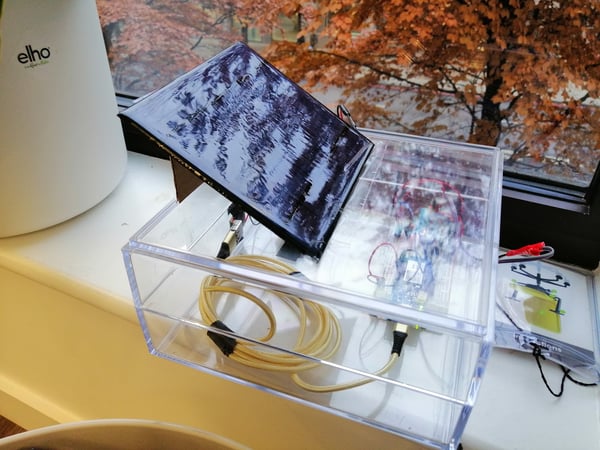
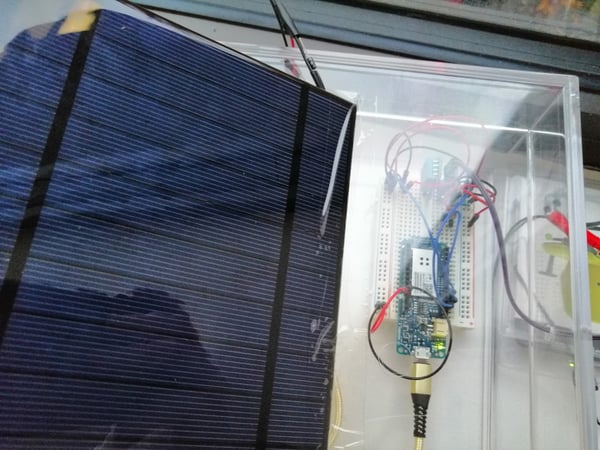
One of the plants was positioned particularly far away from any power sockets, and as the Arduinos require constant power to remain on, this was an issue. A temporary solution was to run a long, perilous cable to the plant, but this just wouldn’t do. Naturally, we decided to go for a solar-powered solution, as it was the obvious choice for something that will be operating near plants which require constant light. After some extensive research into solar powering techniques that would not come with an added fire hazard, we got to work.

Following some minor do-it-yourself work, we had the solar circuit assembled, using two lithium ion rechargeable batteries to store our power, similar to the batteries used in smartphones. With that, our Arduino was ready to be powered by the sun.
However, this does not always provide enough for the board to run, particularly on darker winter days. For this reason, we are now looking into ways to minimize the amount of power used by the Arduino throughout the day. Other than that, our plant sensor now gets its lunch the same way the plants do!
If you have plants that are in need of some more in-depth care and attention, check out the GitHub repository where you can find all of the code that you will need for the device as well as a guide on how to set the data receiver up.