The Stats Girls, a popular girl group founded in the 90s, are about to reunite for an exclusive concert. To make sure their fan base will be there, they asked their marketing analyst, Victoria, to run an online campaign. Victoria quickly realizes that there are countless options to decide on when launching a campaign. What with the colors of the creatives, the publish or release time, and the text length, it is challenging to choose. That is why she is willing to set up an experiment to compare these varying options and learn best practices for future concert promotion.
Struggling to choose the right visual for their concert tour
Granted, running experiments is a reliable way to understand what makes a campaign successful. More important, though, is the path that we take to run them. Not only should Victoria follow statistical methods, but it is also critical for her to standardize and track her experiments. Fortunately, the Stats Girls managed to install the data professionals’ ultimate tool, Dataiku, an end-to-end platform with features for business experts (including marketing analysts like Victoria), data scientists, and engineers to collaborate and build machine learning pipelines from raw data to predictions.
Dataiku’s new A/B testing capabilities introduce an easy and standardized way to carry out marketing experiments. A/B testing is a reliable method to compare two variants of a campaign. Its core idea is simple: You split your audience into two groups, expose them to two different variants, and find out which variant is best. Yet, its implementation is usually tedious. Follow along to find out how Victoria leveraged Dataiku to A/B test her marketing campaigns smoothly!
Your Path to A/B Testing
1. Prepare the Experiment on Dataiku's Visual Interface: So Tell Me What You Want, What You Really Really Want
The Stats Girls are planning to send a special email to invite their biggest fans to the upcoming concert. Victoria is wondering about the ideal send time for this email. This questioning is the cornerstone of any A/B test, as it will help scope the experiment. To perform her A/B test, Victoria should first select the two variants that she wishes to compare. She decides to compare a send time at 9 a.m. (A) to a send time at 2 p.m. (B). Her A and B campaigns should be the same, except for the chosen variation.
Then, she should pick a relevant metric or key performance indicator (KPI) to measure the performance of the campaign. In this case, it makes sense to compare send times with a time-dependent metric, such as the click-through rate (CTR).
You WannA/B With Me, You Gotta Listen Carefully
Admittedly, a test on thousands of users seems more trustworthy than a test on ten users. However, how can you estimate the minimum amount required? More importantly, how can you strike a balance between this statistical constraint and a limited audience size?
The minimum audience size computation results from the types of the campaigns and the guarantees expected from the test. It mainly relies on the following parameters:
- A baseline success rate, the metric value that you would expect from the least performing variant
- The minimum detectable effect, the minimum difference required to determine that a variant performs better
- The statistical significance, the odds that the test finds out that the two variants are performing equally well when this is the case
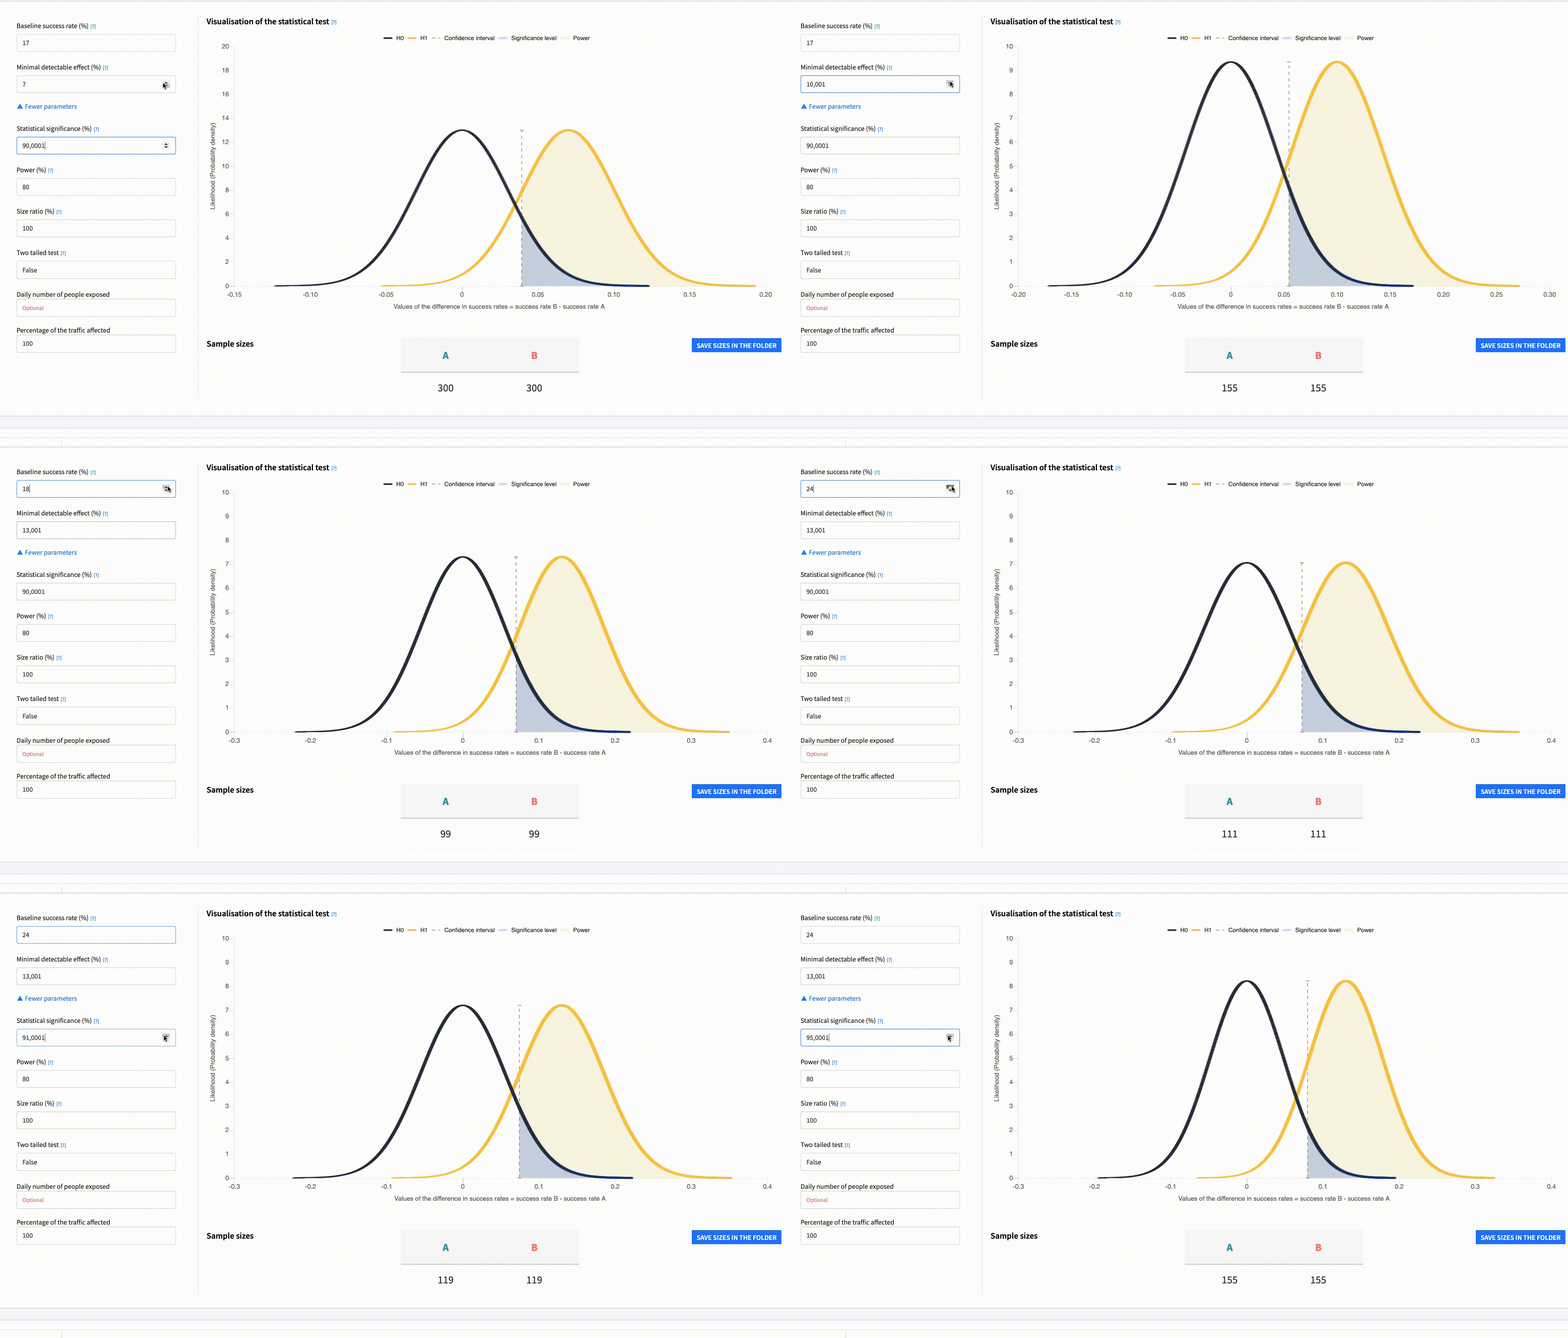
Dataiku's A/B test sample size calculator can help you estimate the sample size while gauging these parameters. From past campaigns, Victoria already has an idea of the average success rate, which can act as a reasonable estimate of her baseline success rate. What is the minimum uplift that she would expect from a "better" send time? It corresponds to the minimum detectable difference.
Regarding statistical significance, it is traditionally equal to 90% or 95%, even if 90% is more common for marketing experiments. Hence, if Victoria’s baseline CTR is 17% and she expects the CTR of a better campaign to be 7% higher, she will need to send 300 emails at 9 a.m. (A) and 300 emails at 2 p.m. (B) for a 90% significance level.

Of course, we often consider the actual audience size when scoping the experiment. If the obtained sample size is too large, Victoria can tune it by increasing the minimum detectable effect, for example. Yet, it will prevent the test from measuring smaller variations and make it less accurate. The statistical significance has a dramatic impact on the sample size, but also guarantees the reliability of the test. Victoria is aware that if it is set too low, the test might detect a nonexistent difference, while if it is too high, it may miss an actual uplift.
It is now clear for her that she needs to send the same email to at least 300 people at 9 a.m. and 300 at 2 p.m. How can she efficiently perform this split? In Dataiku, she runs the population split recipe which automatically performs the split. It concretely retrieves the figures computed in the A/B test sample size calculator and randomly assigns a group to each user. Therefore, as Victoria inputs her list of email addresses, it adds a column “dku_ab_group” to indicate their groups, as shown below.
Victoria is all set up to run her experiment on the platform of her liking. She may use HubSpot for email campaigns, Google Analytics for banners, or LinkedIn for social media ads. To send the invitation email, she chose to rely on HubSpot.
2. Analyze the Results in Dataiku: Get Your Results Together, We Could Be Just Fine
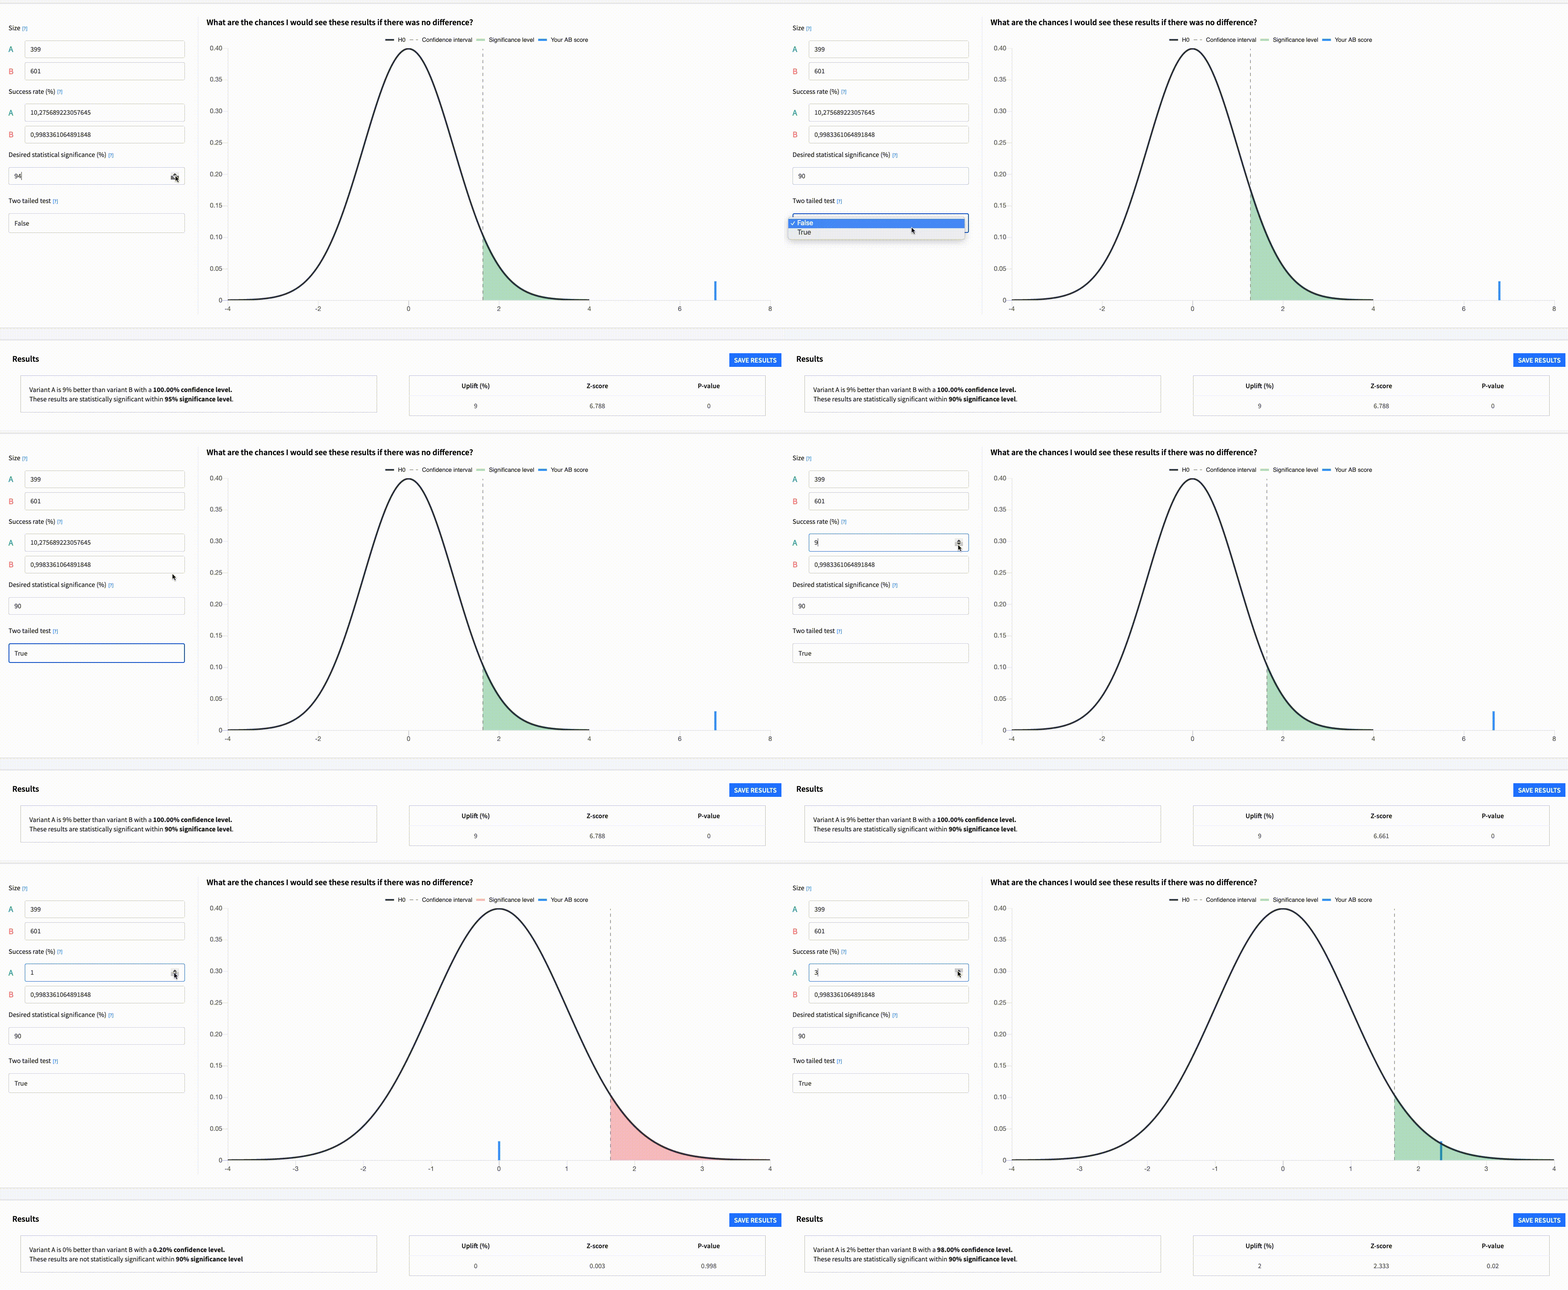
Victoria finished running her experiment and it is now time to analyze its results. There are several options, detailed here, to get the results into Dataiku. Once done, Victoria opens the A/B test analysis web app to understand the outcome of the experiment.

By comparing the success rates and group sizes, the web app measures the potential uplift and the reliability level of the test. Technically, it computes the chances to observe the obtained results if there were no differences between the variants. If the chances are low, namely five or 10%, there is a clear winner! Not only is there an uplift, but the test is statistically relevant within our statistical guarantees. Even if the test is inconclusive, there is a silver lining. Knowing that a variation has a minor impact on performance is already a win. Victoria, who is not much of an early riser, won’t need to wake up earlier to send a campaign at 9 a.m. if 2 p.m. is just as good!
Alright, now we have seen how to perform one A/B test. Yet, what if Victoria wants to run multiple A/B tests and compare them? Dataiku is the perfect place to keep track of her experiments in a standardized way. With the web apps mentioned previously, she can save the parameters and the results of her experiments in Dataiku. Then, it is straightforward to leverage this data in a visual analysis or a dashboard.
3. Key Takeaways: Make It Last Forever, Analytics Never Ends
All in all, Victoria managed to easily run a reproducible A/B test and keep track of it. She learned some best practices that she will be able to apply to future campaigns. So it is a clear win for the Stats Girls!
When your A/B test is successful
Above all, your path to A/B testing is unique — it depends on your campaign types, your internal processes, and your underlying use case. After using the new A/B testing features on her campaigns, however, Victoria learned some common lessons:
- Usually, the audience size is the main limitation. That is why we recommend to overestimate the minimum sample size, especially when you are observing small differences.
- Anything that can go wrong will go wrong. Always plan extra time for good measure.
A/B testing proves to be an efficient and versatile framework to compare marketing campaigns, websites, drugs, and machine learning models, for example. With the A/B test plugin, you can perform an A/B test from design to the analysis of the results. To learn more about the underlying theory, have a look at the blog post “It’s Easy as A,B...C? A Refreshing Approach to A/B Testing.”


