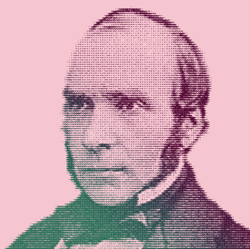
Long before my data science days, I considered majoring in history at university. My journey pivoted since to neuroscience and biotech before eventually landing on data science. It’s no wonder then, given my various interests, that when I was revisiting my love for history on the History of Data Science page, John Snow’s story caught my eye. His famous 19th century epidemiology visual illustration truly inspired me and still has an impact on the way I approach my data science work today.
John Snow Is No John Doe
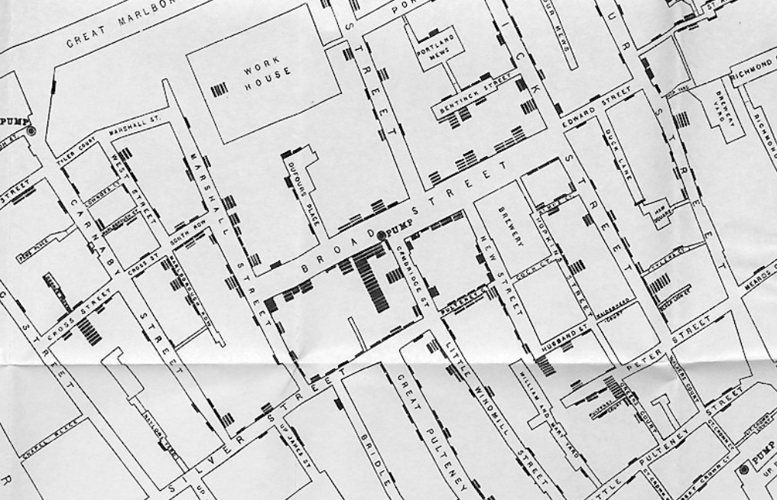
 Sorry to disappoint the Game of Thrones fans, but I’m not talking about Jon Snow. John Snow, an English anesthesiologist, was the single most important contributor for clearing cholera outbreaks in 19th century London and is widely considered the father of modern epidemiology. He created the first epidemiological cluster visualization of fatal cases of cholera in households in Soho, London together with landmarks including water pipes. This pioneering visualization, which shows the proximity of cases and landmarks, is something that we take for granted today. It is one of the most important and inventive tools that Snow came up with, and it is what ultimately convinced reluctant local politicians to shut down a contaminated water pipe in order to save lives.
That critical moment of a scientist communicating an analysis in a visual way is a lesson to any data scientist trying to convey a message to business decision makers. Business stakeholders are not necessarily well versed in data, and at times, don’t even care about the technical aspects of the use case at hand. Whether we like it or not, as data scientists our work can only be impactful if it is understandable and useful for key business decision making.

In the same way that visualization is only the tip of the iceberg of the data scientists’ work, so was Snow’s visual illustration. Looking behind the scenes at Snow’s work reveals a meticulous set of steps that a data scientist can follow to properly scope and deliver projects.
Project Best Practices Inspired by Snow’s Process
- Defining the Problem (and Its Solution): Looking at the problem Snow was facing — high mortality rates from cholera cases — another path could have been chosen by him: identifying better treatments for infected patients. However, Snow’s approach was to prevent cholera cases altogether by finding the root cause, a path that proved itself in solving the problem. As data scientists, we always need to ask ourselves whether we’re identifying and attempting to solve the right problem in the correct way.
- What-If Analysis: Snow found correlation between a certain water pipe to the incidence of cholera cases and proposed what-if the authorities intervene and shutdown that pipe? By intervening, all cholera cases were eradicated from the vicinity. Finding a source of a problem is not a solution alone, some data science use cases require intervention in order to change current outcomes in what we call actionable insights. An extra step is conducting a what-if analysis: Could we change one of the factors if we wanted to? And if so, would it affect the outcome significantly? By how much?
- Subject Matter Experts: At the time of Snow, most disease experts falsely considered “bad air” as the source of cholera. Snow didn’t stop there and interviewed residents of infected areas, experts in their own right and circumstances, with the hope of retrieving insights that would better inform his case. As data scientists, we’re rightfully considered experts on all things data analysis or machine learning, but when it comes to a specific field’s use cases, humility and curiosity should always drive us to consult different kinds of subject matter experts.
- Data Enrichment: Knowing the importance of data enrichment, Snow sought out to add fields of information to his data, as he did with information utilized for the determining water suppliers for pipelines. Data enrichment today is a highly common practice to improve quality of analysis and could be done in a very straightforward manner especially when dealing with structured, publicly available data.
- Exploratory Data Analysis (EDA): Snow understood that an outcome could not be analyzed out of context and without a baseline of comparison. In order to unearth factors related to the outcome of cholera cases, Snow realized he should analyze the non-cases just as much and found a significant factor. There were two water companies that supplied water to pipes. One company was associated with 14 times more cases of cholera than the other. Today, we seamlessly conduct EDA to find clues on how different factors could affect an outcome.
- Features: Snow, it seems, had a conviction that contaminated water was the source of cholera, but importantly he treated this conviction as a hypothesis and put it to the test. He understood that scientists, like everyone else, are exposed to biases. Today, we can hypothesize whether certain factors have an effect on the outcome and then engineer particular features based on these factors and feed them to algorithms that measure levels of importance. Moreover, in this day and age, we can automatically generate features from our existing data, as opposed to hypothesizing to see what would “stick.” Today's data scientists have easy access and should take full advantage of these modern capabilities that were not at Snow's disposal.
The Often Untold Side of the Story
We should also be inspired by what Snow’s story is not. Oftentimes, data science problems today are not as straightforward as Soho’s cholera outbreak. What if, at the time, cholera developed into a disease transmitted from person to person? This would complicate the analysis and perhaps would necessitate different strategies to unearth the root cause of the outbreak and/or to stop it. In that sense Snow was lucky.
At the same time, Snow’s data science story, like many other stories, is a simplification of all the complexities that really happened in reality. Rarely do we read testimonies or see presentations on failed attempts that take place prior to eventual success. A scientific paper in a scientific journal is unlikely to list all of the dead-ends faced before a useful discovery, a cooking blog wouldn’t list all of the disastrous attempts preceding the winning recipe. Similarly, we can assume numerous failures to the triumph of John Snow’s success story, which is all the more inspiring.


