


Emojis are used everywhere in today’s digital world, and sometimes they are used more often than words to represent thoughts, from simple to complex. Yet unlike words, there is no clear dictionary definition for which emojis correspond to exactly what thoughts, ideas, or actions.

Yet by understanding how and why people use certain emojis, businesses can revolutionize the way they execute sentiment analysis, churn prediction, and targeted marketing campaigns. Given the potential, I wanted to delve deeper into the data contained in natural language through emojis. In particular, I looked at:
🇫🇷 France Flag, an homage to Dataiku’s roots.
🙈 “See No Evil” Monkey, because I see it used all the time, but it’s unclear to me how it should really be used.
🙏 Folded Hands, because I’m curious to know if it’s more often used with a positive or negative sentiment.
💔 Broken Heart, to understand what exactly breaks peoples’ hearts.
What Do I Know About Emojis... and About Data Science?
I have been a data science intern at Dataiku’s New York City office since June, and I could not be happier to be working at such an incredible company that empowers other companies and individuals across the world by allowing them to use the latest and most advanced data science and machine learning technologies. Before interning at Dataiku I was at Dartmouth college, where I played D1 basketball and majored in computer science and statistics.
The focus of my internship is building out the internal and external natural language processing (NLP) capabilities of Dataiku. I finished my first project recently, which gets a lot of important statistics from a collection of text corpuses quickly, and I’ve been able to use it to understand what certain emojis represent.
The Process
Before jumping to my conclusions about each of these emojis, here’s a quick overview of how I performed my analysis. I made a Python Jupyter Notebook that collects a lot of important statistics of text data to help anyone with NLP on their data projects. This notebook was able to process 100k Tweets and extract all that information in 4.36 minutes! Not bad for such a large complicated dataset.
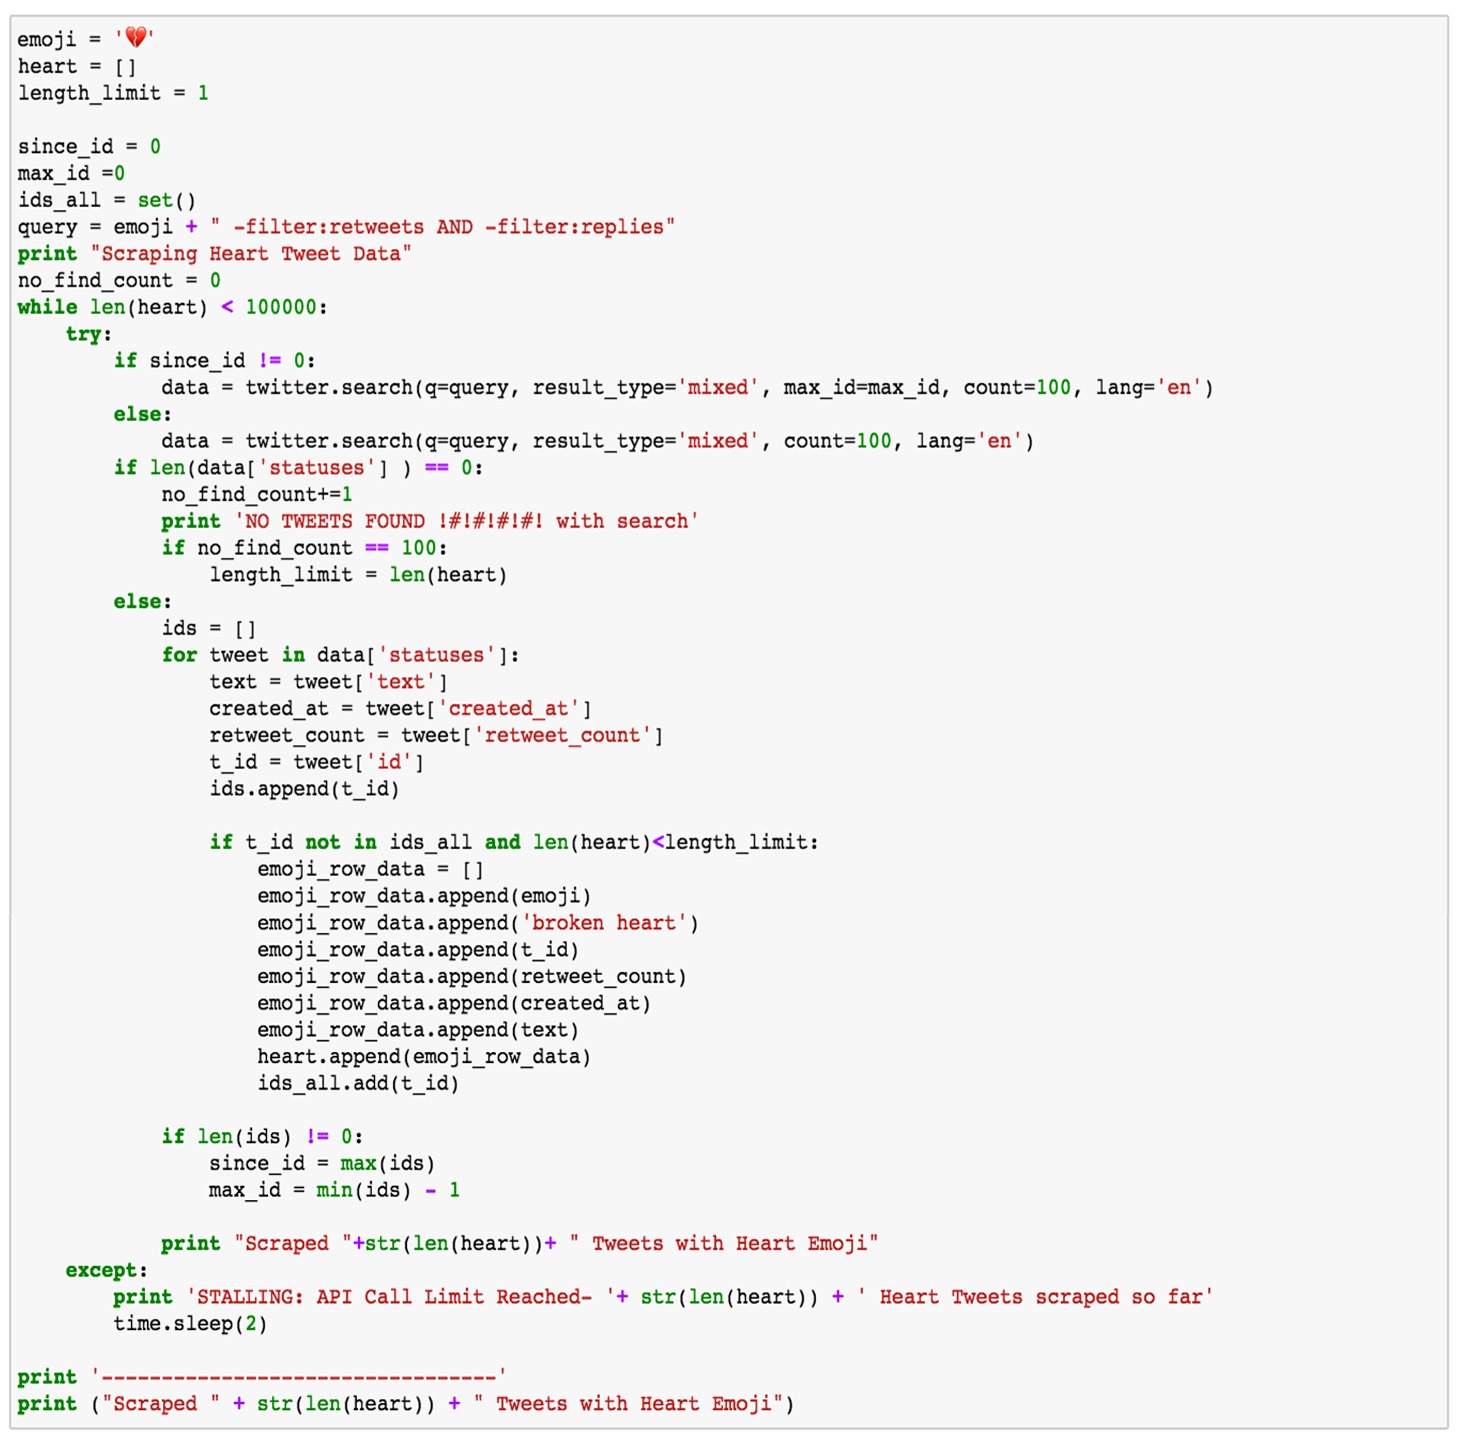
- I pulled text data for analysis from Twitter using Twython. Note that the Twitter search API only allows users to get data on recent Tweets, so it’s important to keep that in mind during our analysis. Also, I was only able to get 15,000 tweets for the French flag emoji compared to the others, where I was able to get 100,000 for each. So right off the bat, it looks like that emoji isn’t as common on Twitter compared to the other three I’m analyzing. Here’s an example of the code I used to get the data for each emoji (click to enlarge):
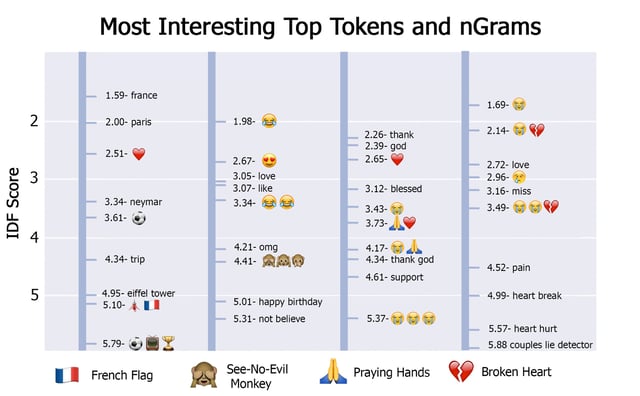
- I analyzed the top tokens/nGrams (basically, sentences/strings of text) associated with these emojis. I wanted to rank all of the tokens/nGrams by some metric, and I decided to use Inverse Document Frequency (IDF), which reflects how important certain words are in the context of each emoji. The lower the IDF score for a token/nGram means the higher probability that it will occur in a Tweet with one of the emojis I am analyzing:
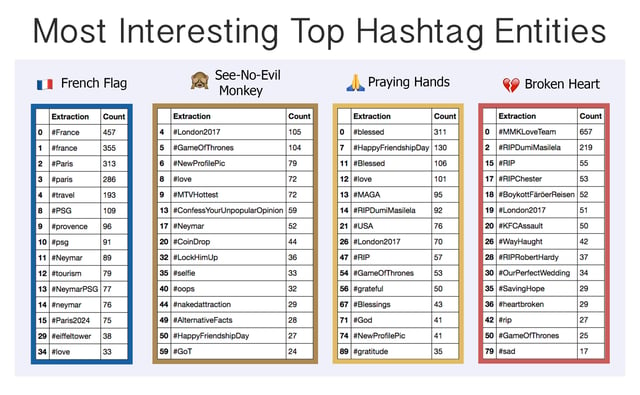
- I analyzed top associated hashtags because of their prevalence on Twitter and because people normally use them to highlight the themes of the message they are trying to convey, so I thought I might get some additional insight:
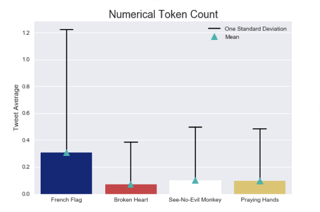
- I also extracted basic text statistics such as word count, exclamation mark count, and generic sentiment score with the averages and standard deviation for each stat. These stats are great for getting a quick general sense of the size, token type, and/or special character distribution of a text dataset.
Conclusions
Though some of the top hashtags were time-related (the Twitter data was pulled from mid-August, so there is some influence from events around that time), I was fortunate enough to have enough other data to give me confidence that this emoji analysis is extracting common themes that are mostly non-time reliant , so I didn’t feel the need to get more Tweets from other dates for this data project. But it also shows and is worth mentioning how important it is to have a balanced dataset for any data science problem.
🇫🇷
Top themes: Paris, love, soccer
Interesting insight: These Tweets were the longest, and they also had the highest numerical token count because of the influence of soccer-related Tweets (scores, jersey numbers, game dates, time, etc.).
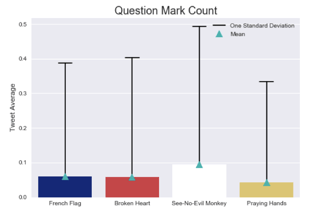
🙈
Top themes: Comical embarrassment, laughter, surprise, attraction, happy birthday
Interesting insight: Contained text with question marks more often than the rest of the emojis.
🙏
Top themes: Feeling grateful/blessed, asking for help
Interesting insight: Contrary to what I would have thought, this emoji is associated with many more positive hashtags than negative or sad ones.
💔
Top themes: Breakups, missing loved ones, sadness
Interesting insight: This emoji was most in line with what I expected to find.
See More
If you want to learn more about text-based analysis, give this post a read for tips on normalization and clustering. And for more fun emoji analysis with data science, I’d recommend this post for a little pop culture 👍 Finally, if you're interested in doing more with social data, read our guide to incorporating Twitter (and other social) data into your greater data strategy.