


In 1776, an instrument maker from the University of Glasgow named James Watt developed a steam engine that was four times more efficient than its predecessor. The engine used one-fourth as much coal to do the same amount of work. Some thought that the demand for coal would drop but the opposite happened.
Watt’s engine lowered the cost of making textiles which lowered the cost of textiles which increased the demand for textiles which increased the number of textile factories which increased the demand for coal to power them. Efficient coal power also caused old factories to convert to it, further increasing demand and kickstarting the first industrial revolution. This second-order effect of needing less of a resource resulting in using more of it is called the Jevons paradox.

The same thing has happened with digital technology many times. Email drastically increased the efficiency of business-to-business communication. We didn’t pocket the savings and spend our time elsewhere. Instead, we did a lot more B2B communication. Hard disk drives increased the efficiency of storing music and videos so we got a lot more music and videos.
Today, most organizations say that they want to become data-driven, yet just one in four have achieved it, and only one out of five have done it broadly across their organization. The stakes are high. Some estimate that poor data costs companies 20% of revenue. While algorithms have made huge strides in the past 20 years — Lasso and Ridge regression, random forests, XGBoost, deep learning, and transformer models — data became the bottleneck of AI/ML innovation. Machine learning pioneers Pedro Domingos and Andrew Ng both recommend that to improve a predictive model, focus on data rather than algorithms. A thousand new input variables are more likely to improve accuracy than algorithm tuning. What can we learn from the Jevons paradox about becoming more data-driven?
Increase the efficiency of using data four times and you’ll use more of it, not less, which leads to new data-driven applications which leads to more demand which kickstarts your data culture. All you need is a steam engine for data.
Data is like coal."
Textile manufacturing, and subsequently steamboats and locomotives, are like today’s AI and machine learning applications. The goal of data-as-a-product is to increase efficiency four times and be the steam engine for data.
What Is Data-as-a-Product?
Data-as-a-product applies product thinking to raw and derived data with the goal of making them much easier to discover, understand, and use. Data products are far more than a few database tables or cloud files and a page in a decoupled catalog. They combine data, documentation, and metadata, as well as code to generate, update, and govern the product into a single design entity. Data products use a method called policy-as-code to include policy enforcement and tracking in the product itself.
Consider some examples. Suppose there’s a policy to update a dataset every week. With data-as-a-product, code to do that — as well as track conformance and violations — is part of the product. If an AI model has a service-level objective to be pulled from production when accuracy drops below 68%, then that’s built into the product rather than delegated to a separate team. If a data product isn’t allowed to use personally identifiable information then the code for generating and updating the product checks for and enforces that itself.
Data-as-a-product does for big data what object-oriented design did for small data."
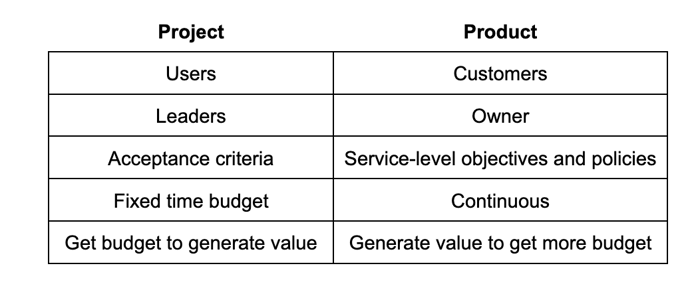
We wrote about this macro trend in analytics two years ago, but the concept is better understood now since it’s a key principle of the data mesh architecture. This table summarizes how data product thinking differ from data project thinking:
Attributes of Data-as-a-Product
Zhamak Dehghani defined the following attributes of data products. For each, we list the Dataiku platform features that support it.
Discoverable: Search for data, comments, data features, or AI/ML models in a single, cross-domain catalog.
Understandable: Good products have good user experiences. Wikis and a few statistics are just the start. To help potential users understand a product, Dataiku also provides visual flows for non-coders, automatic documentation generation, online chat, always-on statistics worksheets, dashboards, visual data exploration, and live code sample notebooks in SQL, R, Python, and Scala.
Trustworthy: Visual flows make it easy to see where data came from. Always-on quality checks include simple metrics such as when it was last updated, number of rows, and null value rate, as well as more complex checks such as drift detection and bias monitoring for sensitive subgroups. Quality and policy checks can be implemented in our no-code environment, SQL or Python. When checks fail, alerts are automatically sent via email, Slack, or Microsoft Teams and can trigger updates or rolling back to earlier versions. Automatic lineage tracking and audit trails are generated for all datasets. Lastly, you can define custom sign-off workflows for a data product that must be followed before the product goes into production. (For more info, see our Trustworthy AI flipbook.)
Accessable: Data products may be provided in customer-friendly formats for a wide variety of uses, such as CSVs, Tableau, Qlik, PowerBI, SQL tables (with built-in connectors to dozens of database types), cloud files, APIs, and apps.
Interoperable: Easy integration with other data products via visual no-code data flows, SQL, R, Python, and Scala. Dataiku uses your data where it is without creating yet another data lake, thus supporting hybrid and multi-cloud environments.
Valuable: Data flows and project dependencies make it easy for everyone to see if and how data products are used.
Secure: Fine-grain, role-based access integrated with your single sign-on, LDAP, or Active Directory. Since we use your data where it is without copying it, we adhere to your current data access rules.
Applying product-thinking to data through these attributes can increase the efficiency of using data four times. We’ve seen it work in many industries around the world.
Customer Stories
One of our multinational e-commerce customers developed a Data Center of Excellence that was in high demand, but soon realized that the Center could never keep up with the business’ expectations. They switched to a decentralized approach with an emphasis on data quality and now have over 1,000 data products and 500 AI/ML models in production.
A global tier-1 U.S. bank we work with set a goal to unlock self-service analytics across their wealth management business. The first step was to systematize a 360-degree view of their customers and continuously update it. They developed 3,000 data products on 500 terabytes of data and now have over 800 analysts using them.
The head of customer data science at Aviva, a multinational insurance company, said that, “Dataiku changed our team atmosphere and culture for the better through sharing capabilities.” Aviva is in the 20% of companies that have developed a data culture that extends to everyone and the business results are huge. Two examples are a five times improvement in data science productivity and more than a 100% increase in cross-selling revenue.
Summary
Storage and computation are nearly free. The best algorithms are free. The bottleneck now is discovering, understanding, and using data. The seven attributes of data-as-a-product described here, when done right, can increase data use efficiency four times, increase the demand for data, increase the innovative use of data, and kickstart your data-driven culture.