


Every year, our Dataiku Lab team presents their annual findings for up-and-coming machine learning (ML) trends in a webinar, based on the extensive work they do in ML research all year. This year, though, we wanted to take a new approach and, instead of solely highlighting the cutting-edge research trends in the space for 2022, we wanted to root that research in reality with real-life data science and AI projects from 2021.
The webinar was presented by Dataiku’s VP of Research (Léo Dreyfus-Schmidt) and Director of Data Science (Reda Affane) and they discuss data drift and anomaly detection, learning with small data, retail markdown optimization and, finally, uplift modeling and causal inference. This post is a transcription of the section on some of the theory behind data changes and model drift, illustrated by a use case on automated factory line inspection. Enjoy!

Léo Dreyfus-Schmidt:
The first topic we're going to talk about is going to be about data drift and anomaly detection. This topic has been key to many industries which are interested in MLOps in general. I'm sure you've heard about that. It's not enough to have data, clean the data, and train a model and deploy to prediction. It's important to be able to tell when that model is drifting away, when the data is drifting away and when it can impact your performance. So it's really something you need to be careful about.
I want to give a bit of backstory about what we can do to detect this and tell you a bit more about the research we’ve done on the topic. This is a really easy scenario, and I'm sure now with COVID, we've been thinking about this a lot. All the data has been changing. It could be in your usage of Netflix or anything else. And we want to be able to tell that something happened, something abnormal happens, something in the data is not as it used to be, and that will ultimately impact the model.

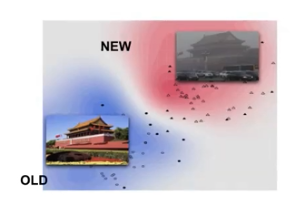
You can see that in an example of pollution in China, for instance. If you have a training set which is really not like the incoming data, normally, you need to be able to detect this and check whether it's going to hurt the model performance and whether you need to retrain or to understand where the data issue comes from. That's the problem that we've been studying. The first technique I want to talk to you about is a really fun one, because it's really using ML models to rescue other ML models.
Imagine you have two distributions of data, which you believe could be different, could be told apart. What you want to do if you think it can be told apart is say, "Okay. If they can be told apart, I can try to learn the classifier, who's going to tell which is which. Which is the new data, which is the old data. And if I can do that, if I can get away with that, with a good accuracy for that classifier, it means that the data are indeed different." This is a really cool technique. It's technically called the domain classifier, which is self-explanatory. And it helps us understand when an available target prediction will change. This is just one example of a technique we can use and we've been using.
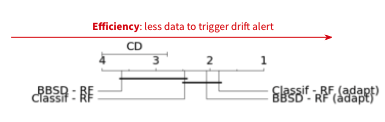
I want to give you also a quick understanding of what we've been doing on the research side, beyond this part. With Simona Maggio, who's our research scientist expert on the topic, we've had the chance to publish that paper at ECML PKDD. And we've been looking at doing extensive benchmarks of various drift detector techniques and collection of datasets, which are especially important in industry, which are mostly tabular data. We've done that by simulating a lot of drifts and we've also, as you can see in the image below, leverage critical diagrams, which is a statistical tool to help tell apart if your technique is actually better or if you're just lucky. I encourage you to have a look at the paper and actually let us know if you have any questions or any interest in following up with that. But it's been one thing we've been actively pushing lately on the topic.
As I said in the beginning, it's not enough to get the data, to train the model, to deploy it, and then to monitor. Once you understand that the data has drifted, you need to do something, obviously. You need to get to the bottom of it. And this is where the investigation starts. This is where you can leverage tools such as interpretability tools, so that you can really understand what's going on. If you had data coming from a sensor, has the sensor become miscalibrated with a change in the data, which you care about, or which you don't think will impact that much what you are doing in your model. So this is also something we've been interested in. How can we get better at not only conveying the message that data has changed, but at identifying how harmful it is for you and your data, and also get as quickly as possible to the source, the root cause of that change?
This is what we've been doing in the research team, but also I'm very interested, and I think this is where, Reda, you have a project that you can tell us about, as I think you have an example which I found super interesting — understanding when the data changes. I'm not going to spoil it more. I'm going to give it to you, Reda, so you can tell us more about this.
Anomaly Detection in Practice: Factory Line Inspection
Reda Affane:
Thank you, Léo. Exactly. We've actually leveraged pretty much the same philosophy, I would say, the same concept that you've just described, which is leveraging, there are changes and there is drift for this specific family of projects that we've investigated, that we've supervised, and some of which we've implemented during the last year. This data drift subject is very interesting because obviously, we see it every day. All of the projects that go through production need that sort of supervision. You put your model into production, you want to be sure that the evaluation, that the performance metrics are still significant, are still under control, are not degrading, for example. One of the sources of degradation is data changing, obviously. And here, what's interesting is that we use that same concept of data changing, and moving, and drifting to do a completely different thing, which is to detect anomalies.
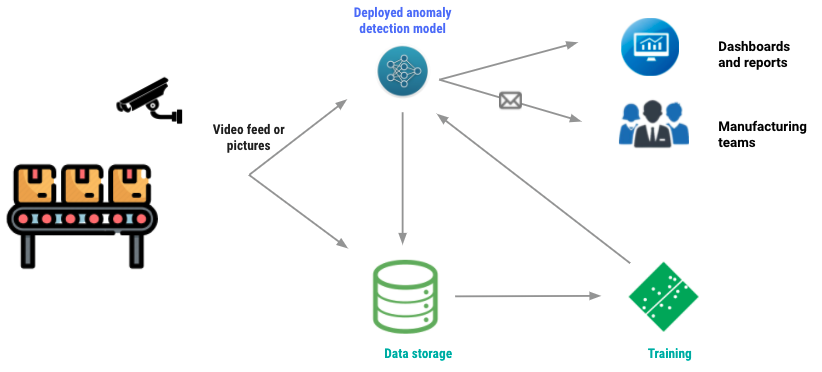
I'm choosing this specific use case or family, again, that we ran in the last year, which is around detecting anomalies on a factory line inspection. Let me just set the scene a little bit and let's imagine in a factory, a production line producing, manufacturing items, and let's suppose we want to detect anomalies on the items. It could be either detecting anomalies on the items, or it could also be detecting anomalies on the machine manufacturing the items. Either way you need some sort of collection device. It could be a simple camera capturing, let's say for example, images at specific periods of time, or maybe a video feed.
Generally, you will have this camera connecting to your data layer storage, so you store those images in the data layered storage, but also you'll have this deployed model, which runs anomaly detection, preferably in real time, because you want to be able to detect if a product is degraded, so you want to remove it from the production line, or if a machine is anomalous, you want to stop as soon as possible your production line, so you don't waste as many items, which were not going to be sold afterwards.
This deploying machinery anomaly detection model will obviously detect anomalies when there are and will also notify the manufacturing teams or the teams at the factory side, or maybe come and update a dashboard, which is leveraged by the pertinent stakeholders. For the sake of completeness and, to finish the loop, you will have, of course, for exactly the same reasons that you mentioned before, a training or retraining strategy to re-update that model to redeploy that model in production. Now, this is the schema that we usually see and that we usually implement. I just want to concentrate for a little bit on the actual anomaly detection model.
I want to speak a little bit of the different types of approaches that we've seen and before that, I just want to describe at least my view of the different families of anomaly detection models, which are usually deep learning. The backbone are usually deep learning models since we are addressing analyzing images or videos. And the first distinction that we can make in this family of models is whether you have labeled data and unlabeled data. And I'm making this distinction, because I know Léo, you also have a lot to say about this subject and I'm going to be happy to pass it to you to talk a little bit more about this specific situation. And we're going to see that later, but let me just start first with labeled data. This is the, I would say, the easiest one, but also the less common one.
Most of the time, you don't have this type of data, but when we do, we have specifically two goals. Either we want to detect an anomaly on an image. The input is the image and the output is yes, there is an anomaly, no, there is no anomaly. Or maybe you want to evaluate the type of anomalies if you happen to have multiple types of anomalies. For example, in this case, it would be a multi-class classification problem. Or maybe you want to go a little bit further, and you don't want to only detect anomalies, you want to localize it within the specific image. In this case, you also have several techniques. You have your standard object detection models, which are going to draw a rectangle around your anomaly or other shapes.
We also have your image segmentation models, which are a little bit more fine grain and can help you localize anomalies really at the pixel level. Now, what's interesting now is the other section, which I'm going to address a little bit more in detail, which is how to detect anomalies when you don't have labeled data. And I need to be a little bit more precise when I say unlabeled data. What I mean here is we don't have labels for anomalous images. And this is actually, I would say, 90% of the use cases or the majority of the use cases. You have easy access to normal data. You know what normal data looks like. You have those actual data, you have those actual images, but you do not have labels for situations where there is an anomaly or anomalous data. This is what I mean by unlabeled data.
In this situation, you can still do detection, for example. Here, most of the commonly used techniques are autoencoders or variational autoencoders or even GANs. These models are trained to reconstruct the normal images. They are trained on all the normal images and they try to reconstruct them as faithfully as possible. And then at test time, you pass in your image and you assess how well this image is reconstructed. If it's faithfully reconstructed, you deduce that's a normal image. If you have some difficulties reconstructing the image, then you can deduce that this image probably doesn't look similar to my normal images, so it probably contains, for example, an anomaly. This is the approximation which is made here.
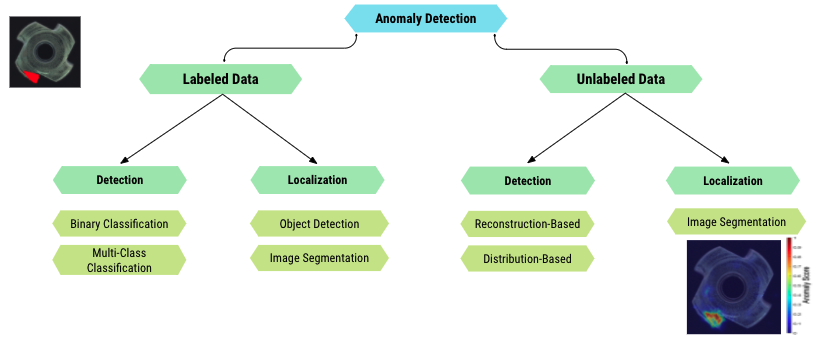
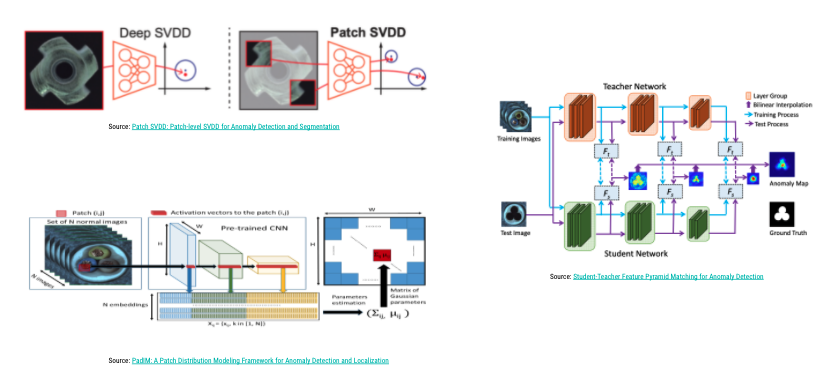
The hardest it is for the model to reconstruct the image, the higher the anomaly score that we give to that image. This is pretty much the overall philosophy used behind these techniques. And the last segment, which is the one I'm going to spend a little bit, a couple of minutes more introducing some architectures that we've seen, which leverage again is how you would localize exactly where the anomaly is. These are three architectures that I've chosen because we've seen them in the past, we have experience with them, and I just want to give you the overall idea of how they work, because at the end of the day, they share the same philosophy which is to understand what the normal data look like.
Let's try to have the most precise presentation of the normal, non-anomalous data. And then whenever you have a new image, a new data point, we compute some sort of similarity between this image and the model's representation of normal data. If these similarities are close, then the anomaly score is low. If the similarity is very low, then the anomaly score is high. Let's take for example, the first model, (which is on the top left) very quickly to give you the intuition. If we look at the first one, which is called Deep SVDD, you can see an encoder and the overall idea is that the encoder tries to map every image of the training set to a feature vector which is lying in the smallest hypersphere possible.
The encoder is actually trained to reduce the distance between each representation of each normal image and the center of the hypersphere. We're trying to find some kind of subspace on the feature space which gathers all the normal, non-anomalous images. And then, at test time, you just pass in the image you're trying to score, and you just compute the distance between the representation of that new image that you're trying to score and the closest point of the sphere. That gives you your anomaly score. If you are far away, the anomaly score is high. If you're close to the sphere or if you're in the sphere, then most probably this is a normal image. Remember, we're talking about localization, so we want fine-grained localization of the anomaly and not only detection.
There's this technique which is usually used also in many models. We see it a lot. It's basically dividing the image into multiple small batches and applying the same technique to every batch. Instead of having one decision, anomaly or not, you have the same decision, but at the batch level, which is also reflected at the pixel level. At the end of the day, you have this nice map that I showed you here, which tells you exactly where the anomaly lies. I'm not going to talk about all the models, I just want to say that this model works when practiced. The showcase performance is actually very nice. I invite you to go ahead and look at the paper.
But there's obviously a problem with this one, which is like a computational problem, because you need to compute the distance between every image that you want to score and all the other images of the train set. Then you have other techniques which try and help alleviate this problem, so if you look at the one which is on the top left, it's pretty much the same idea. Instead of having an encoder, we have a pre-train. And then here, what we're trying to do is that we're trying to get a probabilistic representation of each little batch of our training images. We assume (or the author assumes) that every batch of the train images follows a multivariate Gaussian distribution and the parameters of this Gaussian distribution are approximated by the extracted features from the CNN.
The overall idea here is at test time, instead of computing the distance between your scoring images, the image you want to score and all the other images of the train set, you just need to compute a distance between the image you want to score and this distribution, so it's much faster, and actually the results are as good as the first model. I'm going to stop here. I'm not going to discuss the third one, but feel free to go and look at the paper. Actually, the third architecture is the most recent architecture that we leverage and the results were satisfying, let's say, and the model is actually deployed in production, and we're happy about V1, but we're already thinking about V2.
One of the options that we're investigating, which is... We know, we are sure, actually, that if we can get our hands around some labeled anomalous images, then it will probably help the performance and make the prediction better and more precise. Obviously, if I start collecting my data now, in two or three months, I'm not going to have a huge amount of data because these anomalies only happen once in a while, by definition. In three months, I'm going to have very little labeled data and we're actually asking ourselves at this point, what can we do with this few labeled data? I guess this is my question to you, Léo, this is not only specific for the subject, this is a more global subject and that we also see it every day, what's our best options? What can we do when we have this kind of situation where we only have very few labeled datasets?
Stay tuned for our next article which will deep dive into the next ML trend for 2022, learning with small data, which is all about dealing with unlabeled data, notably through active learning.