4. Regular Expressions
We think regular expressions are a bit underrated, since they enable precise language parsing. These patterns can be hyper specific—replacing “apple” with “banana”— or can be a bit more variable, such that they would return any word that starts with ‘a’ and ends with ‘e.’ Without them, finding specific phrases or text constructions (like emails or dates) in large data sets would be very laborious. There are many supporting text editors that make testing and debugging your regular expressions a breeze.3. Seaborn Plotting in Python
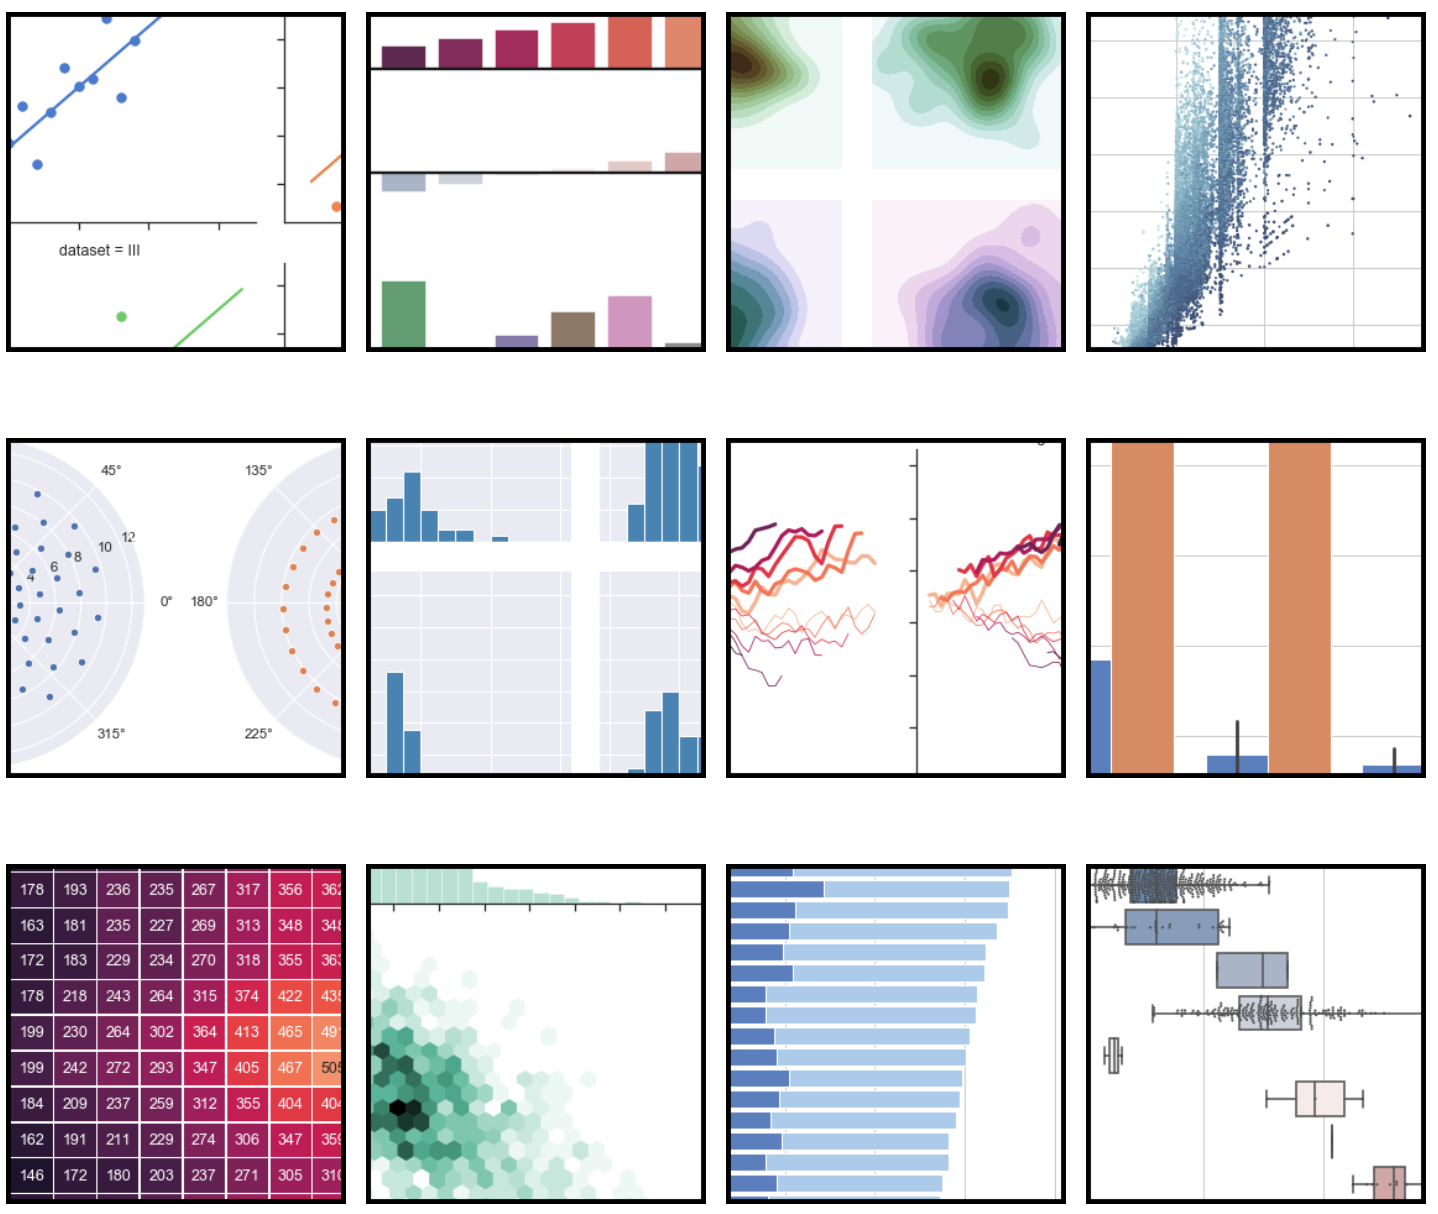
Seaborn is a Python visualization library that enables everything from single plots to multi-plot grids. Now in version 0.9.0, the Seaborn library recognizes that one size doesn’t fit all when it comes to graphically understanding your data. It’s based on matplotlib and closely integrated with pandas data structures. When you try to use matplotlib directly, you need to translate each variable into specific parameters of the visualization model, however Seaborn Plotting eliminates this hassle. The library seeks to make visualization a key part in understanding and exploring data, rather than a summary step at the end of the analysis process.
2. R Studio
This is one of our favorite tools when we’re working in R. R Studio is an integrated development environment (IDE) that was made especially for R, but can incorporate HTML, PDFs, word documents, and slide shows too. There’s a smooth organizational system you can customize to handle multiple working directories. The editor offers syntax highlighting, code completion, and smart indentation. If that wasn’t enough, the workspace manager enables you to execute code directly from the editor. There is an R documentation resource and assistance integrated into the IDE so if you forget some specific syntax, R Studio can guide you through it. There’s also serious debugging support to help diagnose and address errors quickly. R Studio is customizable too, and comes in open source and paid commercial editions.


