


As we saw in the first part of this blog series, marketing attribution aims to assign the credit for a purchase to the marketing channels (ads, email campaigns, etc) with which the user has interacted prior to making the purchase. Eventually, this could allow marketers to better allocate their budgets among different marketing channels in order to boost sales and improve the ROI.

In the first part of this blog post, we assumed that we had the data in the correct format, before applying any kind of attribution modeling. As you probably already know, life isn’t always that kind. This blog post will exclusively focus on processing the raw data so that modelization can occur. We will talk about tracking customers, sessionization, and other key concepts behind this process. We will also explore a few snippets of code to implement our processing.
Track Your Customers
First things first, in order to appreciate the relevance of the marketing channels, regardless of the algorithm used, we need to construct a map of all the interactions that led a customer to purchase an item. This means tracking and collecting all the interactions that each visitor had with the service: let’s assume for example that this is a retailer website from now on.
This is usually done using cookies. A cookie is a piece of text sent to your browser from the websites you visit, which is then stored on your device. Cookies enable websites to identify you when you return. This way, all the pages you visit within a website can be traced back to you. However, for marketing attribution purposes, this isn’t quite enough. Indeed, one needs to identify the actions taken by a certain user on the website, (purchase, add an item to cart, etc) but also identify the path the user took to arrive at the website, also known as the referrer (e.g. did they click on a sponsored link on google or open an email?) Most of the tools out there which offer solutions for tracking source traffic (Google Analytics, MixPanel, Heap, etc) use a simple technic called UTM parameters. UTM parameters are tags which are appended to the referring URL on the advertiser website. When a user clicks on an ad (and gets redirected to the retailer website), the relevant information (the identifier of the ad, the campaign it falls under, etc) is sent to the tracking system. Here is an example of a URL with UTM parameters:

When a user clicks on this link, the retailer website will know that this user clicked on an ad on the company’s Twitter page, which is related to the campaign operationY which was set up on social media.
Sessionization:
Let us assume now that we are able to efficiently track our customers’ interactions to the website. This is just the start. We now need to organize these interactions in order to construct each customer’s journey to the conversion. There are several factors to consider:
1. In order to construct these journeys, we need a precise map of each customer’s navigational behavior. This is where sessionization comes into play. A customer session is the time period through which the customer remains active on the website, a useful measurement for customer activity. So if you are navigating through a product catalog on Amazon for example, and took a 10 minutes break to come back later, this experience will count as 2 distinct sessions, separated by 10 minutes. Consider the following example, which presents each page of the website visited by a particular user in blue dots, ordered in time: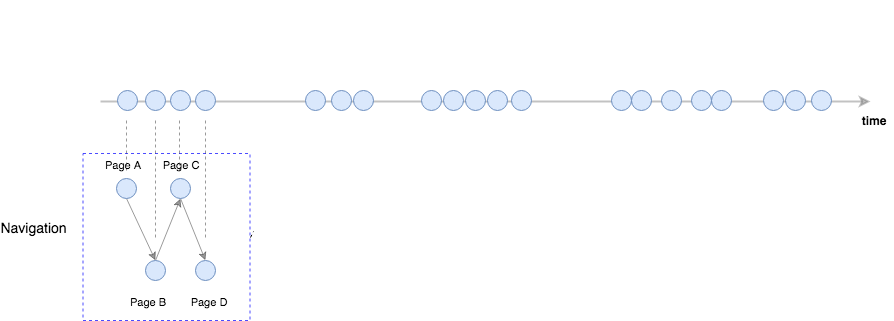 A customer journey: each circle represents a visit to a website page by the customer.
Lexical side point: we will refer to the blue dots as touchpoints from now on. You should think of a touchpoint as a record of the customer’s visit to the retailer website as well as a record of the corresponding referrer.
We can clearly distinguish clusters of events that seem to belong to a unique customer navigation experience. For the purpose of this blog post, we will refer to these clusters as micro-sessions. We need to define the amount of time that needs to pass before evaluating the next visit to the website as part of a new micro-session. The value of this time parameter needs to be defined carefully and will usually depend on the business itself. Conventionally, a value of 30 minutes is used. Here is what the results of this process would look like with a value of the time parameter equals to T_inactivity.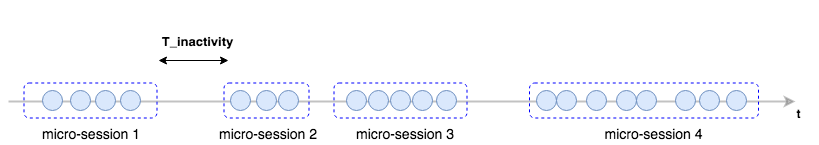
2. We want to reconstruct the customer’s journey, and for that, we only need the touchpoints which have referrers coming from the outside of the website. Why? Because those would be the links of the ads that we put on the advertisers' websites. Let’s try to imagine a typical customer journey. The first touchpoint is when the customer clicks on a Twitter ad that redirects him to the website. Then the user navigates through a catalog of products, which generates additional touchpoints. We don’t need these in the context of attribution analysis, so they can be discarded. The goal is to only keep the first touchpoint of each micro-session, as shown below: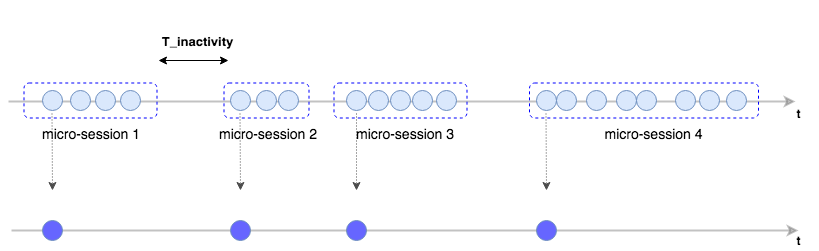
From now on, we will only deal with these filtered touchpoints (in dark blue dots). Let us now add the events corresponding to conversions in the mix (in light blue stars). Remember that a conversion in this example is simply the purchase event.
Now we need to clearly define what constitutes a customer journey: a customer journey is a succession of touchpoints that may or may not end in a purchase. As you can see from the above image, a user could make several purchases along the way, which means that more than one journey can be linked to a customer. We will refer to these journeys as macro-sessions. How could we distinguish these macro-sessions? For example: once a conversion took place at time T, what are the touchpoints leading to this event which we can reasonably consider as being part of this specific macro-session? Should we consider an ad-click that occurred a year prior to purchase as part of the customer’s journey? Again, this temporal parameter is crucial and need to be defined with the specific needs of the business in mind. For the following example, let’s refer to this parameter as T_window (defaulted to 30 days in Google Analytics)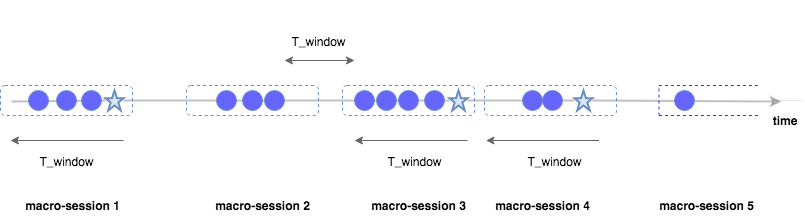
The value of T_window defines how many touchpoints prior to the purchase should we consider for the current macro-session, and hence defines the limit of this macro-session.
It is important to note that a macro-session does not necessarily end with a conversion: macro-session 2, for example, doesn’t lead to a conversion, since the time between the last touchpoint of this session and the next one is greater than T_window. This is a key difference between heuristic and algorithmic model (if you’d like to know more about these models and haven’t read the first blog post yet, have a look here). Heuristic models link the purchase event with one or more touchpoints based on fixed rules, so they only need to consider the macro-sessions which end with a purchase. Conversely, algorithmic models consider both macro-sessions which lead to a purchase and those which do not, in order to unravel the relationship between the customer’s journey and the purchase event.
Let’s Get Technical
In the following, we are going to implement a basic version of this two-step sessionization. In order to prevent this blog post from becoming too code heavy, we are only going to go through the first step. However, you can find the subsequent code in the appendix.
Step 1: Micro-Session Reconstruction
Let us assume that we have a history of recorded customer interactions with the retailer website in the following format:
log_data: user_id | touchpoint | timestamp
Each row of the input dataset is a record of a customer’s action. Here the touchpoint holds the value of the referrer. It could be an ad for example, if the user came to the website from the outside, or it could one of the retailer’s website pages, if the customer was browsing the website.
Examples:
user_12FG4 | shopping_cart_page| 12–09–2017 14:45:06
user_76DF5 | Facebook Ad| 09–12–2017 09:55:36
We’ll start by constructing the micro-sessions. We’re aiming to create a new table with the schema:
log_data_sessions: user_id | user_micro_session | touchpoint | timestamp
where user_micro_session would be a unique identifier for each user’s micro-session.
Since the rule is established to end the micro-session when the time between two clicks is greater than T_inactivity, we are going to compute the difference of time between every two touchpoints for each customer. For that, we are going to use Postgres and window functions as follows:
SELECT
    *,
    extract(epoch FROM "timestamp")
    - lag(
        extract(epoch from "timestamp")
        ) over (
        PARTITION BY "user_id"
        order by "timestamp"
                ) as "time_difference"
FROM log_data
The next step is to compare every value of the column time_difference with the value of T_window, which we will define as 30 minutes in this example. We are going to flag the cases where the value of time_difference is greater than T_window with a flag of 1 while giving all the other cases a value of 0. Let’s build on the previous code:
SELECT
    *,
    CASE WHEN
        EXTRACT(epoch FROM "timestamp")
        - LAG(
            EXTRACT(epoch FROM "timestamp")
            ) OVER (
        PARTITION BY "user_id"
        ORDER BY "timestamp"
                    ) >= 30 * 60 THEN 1 ELSE 0 END as new_micro_session
FROM log_data
Let’s now create a new session_id for a customer, each time the column new_micro_session is equal to 1. One possible solution for doing this is to concatenate the user_id value with the cumulative sum of the column new_micro_session.
SELECT *,
       "user_id" || '_' || SUM("new_micro_session")
       OVER (PARTITION BY "user_id"
             ORDER BY "timestamp") AS "user_micro_session"
FROM (
  SELECT
      *,
      CASE WHEN
          EXTRACT(epoch FROM "timestamp")
          - LAG(
              EXTRACT(epoch FROM "timestamp")
              ) OVER (
          PARTITION BY "user_id"
          ORDER BY "timestamp"
                      ) >= 30 * 60 THEN 1 ELSE 0 END as new_micro_session
  FROM log_data
  )t
The critical part here is to retain only the first touchpoint from each customer micro-session, as explained earlier:
SELECT "user_id",
       "channel",
       "timestamp"
FROM(
    SELECT *,
            FIRST_VALUE("touchpoint") over(
                PARTITION BY "user_id", "user_micro_session"
                ORDER BY "timestamp") as "channel"
    FROM(
        SELECT *,
               "user_id" || '_' || SUM("new_micro_session")
               OVER (PARTITION BY "user_id"
                     ORDER BY "timestamp") AS "user_micro_session"
        FROM (
          SELECT
              *,
              CASE WHEN
                  EXTRACT(epoch FROM "timestamp")
                  - LAG(
                      EXTRACT(epoch FROM "timestamp")
                      ) OVER (
                  PARTITION BY "user_id"
                  ORDER BY "timestamp"
                              ) >= 30 * 60 THEN 1 ELSE 0 END as new_micro_session
          FROM "log_data"
          )t1
      )t2
  )t3
GROUP BY 1,2,3
That’s it! This will cut all the customer interactions into several micro-session. We still need to construct the macro-sessions, which is relatively similar to what we did here; the code for this portion is in the Appendix.
Limitations
It goes without saying that this is the most crucial step to get your marketing attribution project going. The data ingestion pipeline should allow tracking for all the customer-specific information that we used above. From past experience, this is the stage where most organizations will fail and realize that they are missing some key data to carry on the attribution analysis.
One of the most recurring difficulties that organizations face at this point is collecting customer data across their devices. Imagine you are offering your services through a website, as well as an Android/IOS application that could be run on smartphones and tablets. How would you trace actions made on different devices to the same customer? The answer becomes trivial if your service requires customer accounts (e.g. using a username/password), but it is much more difficult if such a mechanism doesn’t exist.
Another difficulty appears when the organization sells its products/services through a physical store. It becomes almost impossible to relate a purchase done in a physical store to the customer’s digital activity.
Conclusion
At this point, you have all the tools you need to kickoff (or reconsider) your marketing attribution strategy. But there is still one vital point which we didn’t address. In the first blog post, we discussed a number of marketing attribution models: Heuristic models (First Click, Last lick, etc), and algorithmic models (Game theory models, Markovian models, Survival theory models, etc). This raises an important question over which model to actually use. Is there a best single model for all situations? Or are there models which perform best for specific businesses and data? These are the kind of questions that we will address in the third and final blog post. Stay tuned!